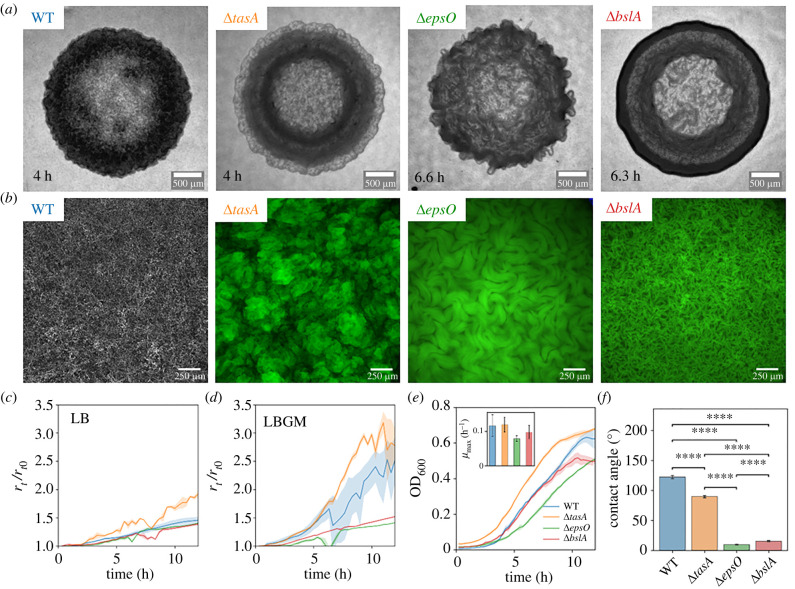
Figure 1.
Characterization of the biofilm colonies formed by B. subtilis NCIB 3610 WT (blue), ΔtasA (orange), ΔepsO (green) and ΔbslA (red). (a) Bright-field images of the biofilm colonies formed on 1% (w/v) LBGM agar pads imaged at 2× magnification. We report images of colonies that reached a radius of 1.4 mm. The ages of the colonies are staggered and are indicated in the panels. The scale bar is 500 μm. (b) Representative images acquired at 10× of the central region of the biofilm colonies taken at the biofilm–agar interface in (a). The WT was imaged in phase contrast. The fluorescent mutants were imaged in an epifluorescence configuration (mCherry for ΔtasA; GFP for ΔepsO and ΔbslA). (c) Temporal evolution of the radius of the colonies, rt, normalized to the initial radius, r0, grown on LB agar pads. The line represents the mean while the shading represents the standard deviation of the mean. The same applies for the data shown in (d,e). (d) Normalized radius, rt/r0, as in (c), for colonies grown on LBGM agar pads. (e) Growth curves in LBGM medium of the planktonic cultures of the WT and the mutants. The inset shows the mean maximal growth rate μmax measured on the growth curves. The error bars show the standard deviation of the mean. Statistical analysis revealed that none of the mean maximal growth rates are significantly different. (f) Contact angle of deionized water measured on the biofilm surface after 18 h of growth. The bars represent the mean and the error bars show the standard deviation of the mean. The statistical difference was computed with a t-test (ns, not significant; ****p-value 0.0001).

