
FIGURE 3:
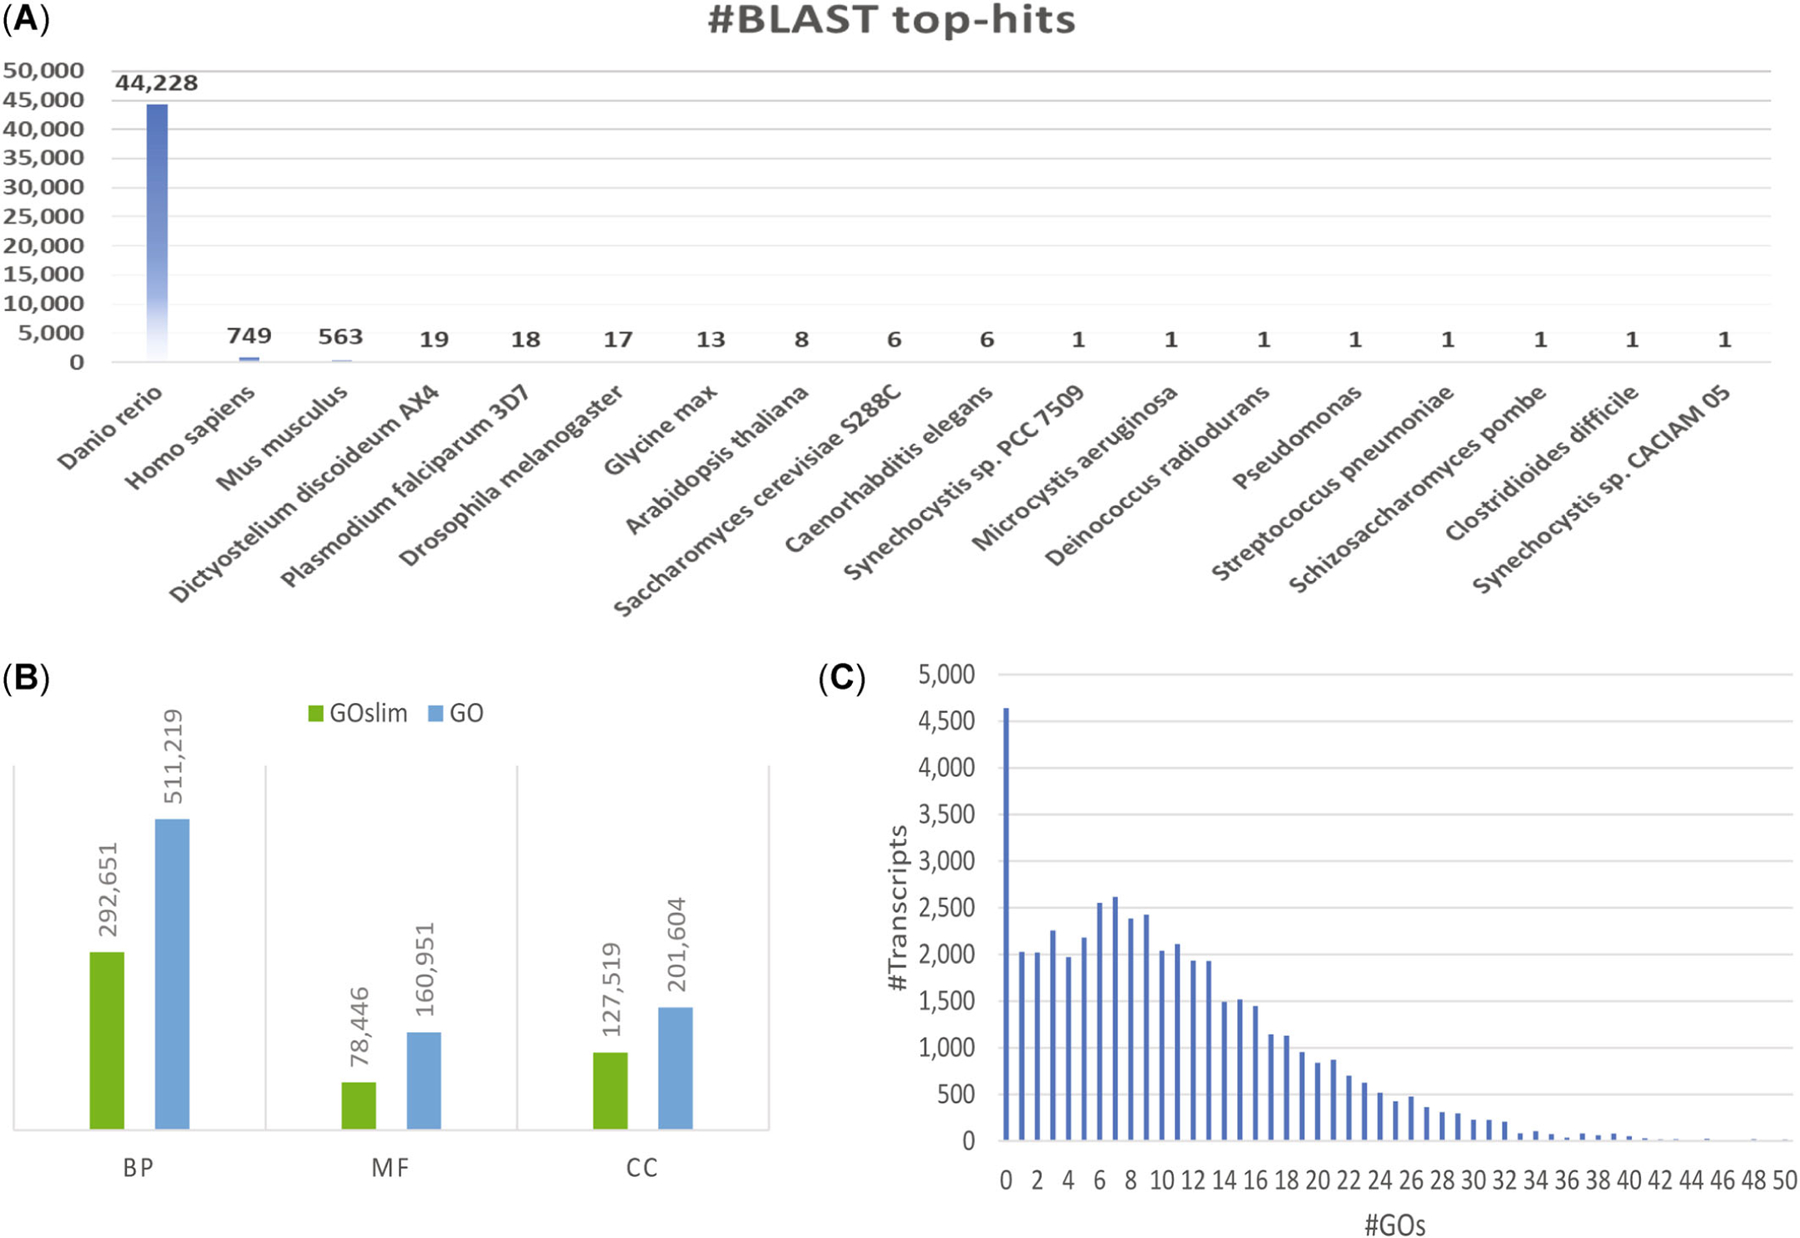
Gene function annotation and visualization. (A) Distribution of 27 landmark species with respect to the number of top-blast hits in homolog search. (B) Gene ontology (GO) term distribution among biological process, molecular function, and cellular compartment categories. (C) GO term distribution among all predicted transcripts in the fathead minnow genome. BP = biological process; MF = molecular function; CC = cellular compartment.