
Figure 2.
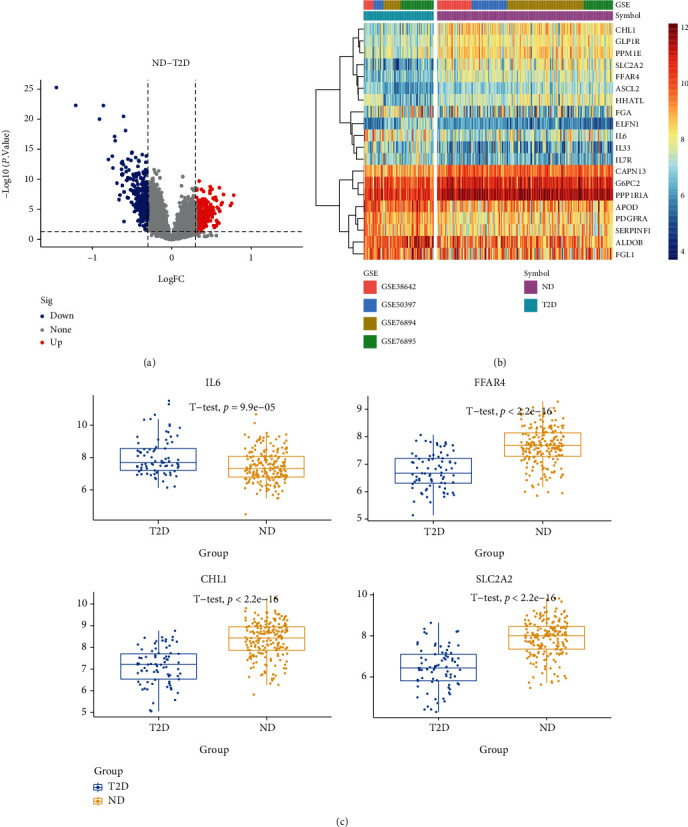
Volcano plots, heatmaps, and gene expression profiles of DEGs in ND-T2D. (a) Number and distribution of up and downregulated genes. (b) Heatmap for DEGs generated by comparison in ND and T2D. Row is the gene, and column name is the samples, which is not shown in plot. DEGs were determined by Wilcoxon rank sum test with q < 0.05 and log2FC > 0.3 as the significance threshold. (c) Expression levels of some DEGs in ND and T2D.