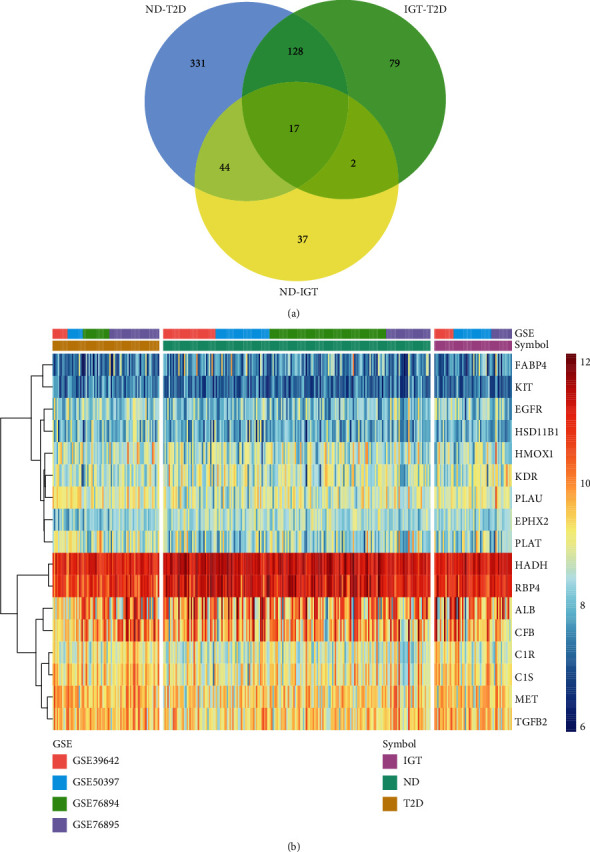
Figure 3.

Venn diagrams and heatmaps of intersecting genes in ND-IGT-T2D. (a) Venn plots showing common upregulated and downregulated DEGs shared by ND-IGT, IGT-T2D, and ND-T2D. (b) The expression level of common up and downregulated DEGs in ND, IGT, and T2D.
