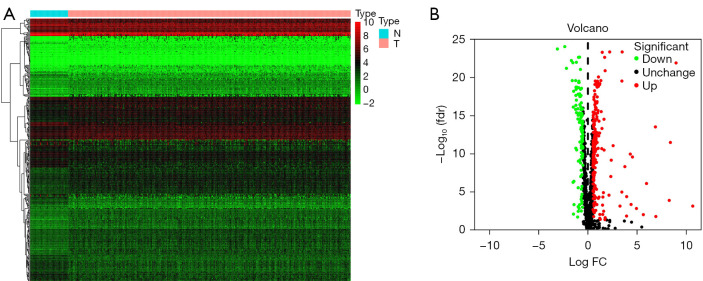
Figure 1.
Identification of DE RBPs in the TCGA database and enrichment analysis. (A) Heatmap of the DE RBPs based on P values and fold change. Red represents high expression, and green represents low expression. (B) Volcano plot of all DE RBPs between liver cancer and normal samples. Red: upregulated RBPs; black: unchanged RBPs; green: downregulated RBPs. DE RBPs, differentially expressed RNA binding proteins.

