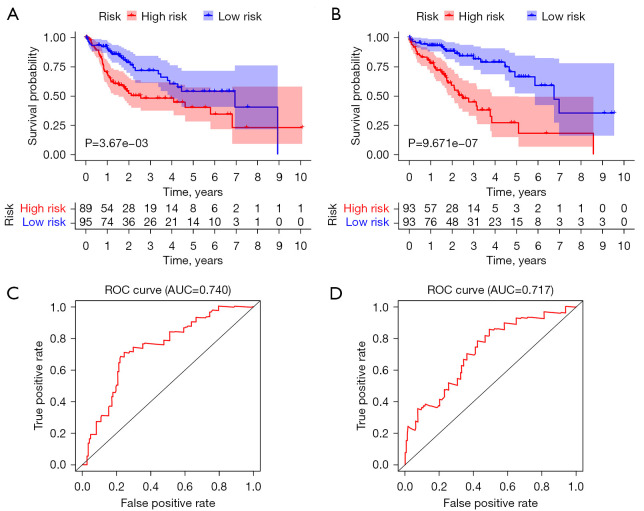
Figure 6.
Survival difference between the test group and the training group. (A) Kaplan-Meier survival curve of the test group. (B) Kaplan-Meier survival curve of the training group. (C) ROC curve of the test group. (D) ROC curve of the training group. ROC, receiver operating characteristic; AUC, area under the curve.

