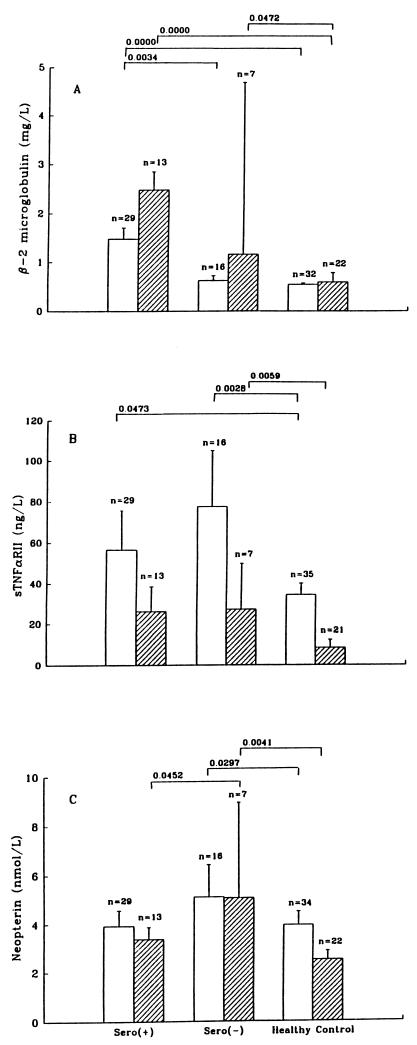
FIG. 1.
Comparison of concentrations of β2M (A), sTNFαRII (B), and NPT (C) in oral fluids of seropositive and seronegative homosexual men and a reference population. For OMT (open bars) and saliva (crossed bars) specimens, the number of samples (n) in each group is shown. Data are medians and standard errors. The P values of differences that are statistically significant are shown at the top.

