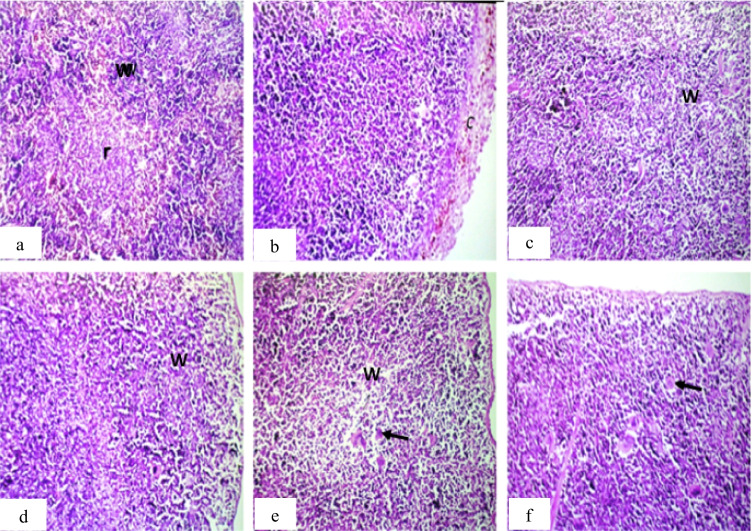
Fig. 6.
Photomicrograph of spleen sections of mice. a Group 1 (control) showing normal histological structure of the white (w) and red (r) pulps. b Group 2 (IP-MNPs) showing thickening, pigmentation, and inflammatory cell infiltration in the splenic capsule (c). c and d group 3 (IM-MNPs) and group 4 (ESC) showing lymphoid depletion in the white pulps (w). e Group 5 (ESC + IP-MNPs) showing lymphoid depletion in the white pulps (w) with massive number of megakaryoblasts (arrow). f Group 6 (ESC + IT-MNPs) showing massive number of megakaryoblasts (arrow). H&E, 40 ×

