
Figure 3.
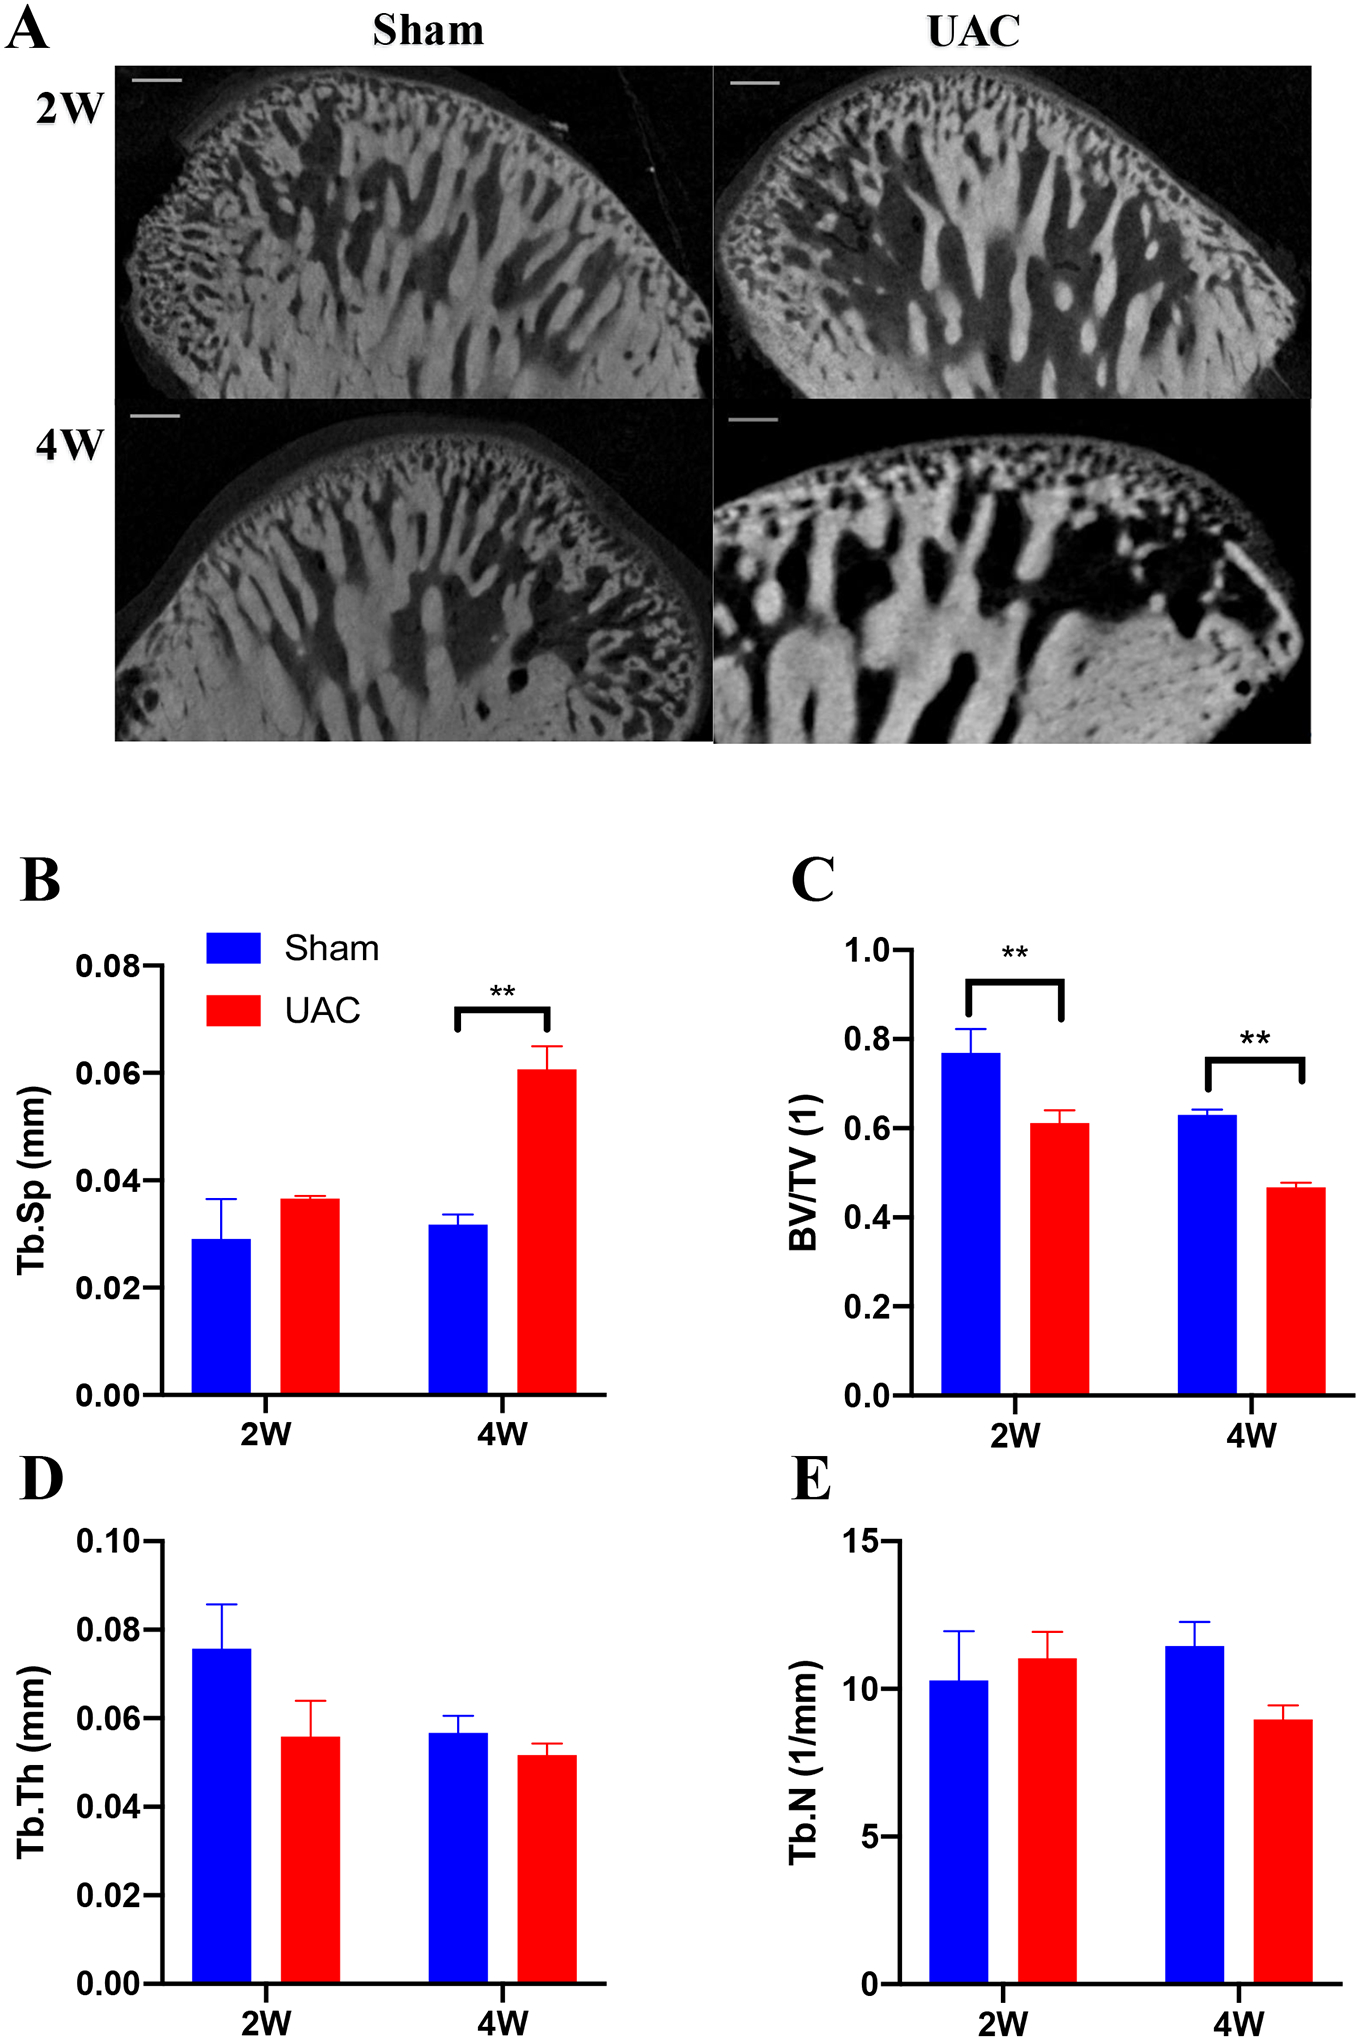
The micro–computed tomography images and bone histomorphology parameters of temporomandibular joint condyles. A: The micro–computed tomography images reflect the changes in the subchondral bone morphology of the condyle in three dimensions at 2 and 4 weeks post UAC, respectively. Bar = 160 μm. B: The trabecular bone separation (Tb. Sp). C: Bone volume/total volume (BV/TV). D: Trabecular thickness (Tb. Th). E: Number of trabeculae (Tb. N). ** p < 0.01 vs. sham.