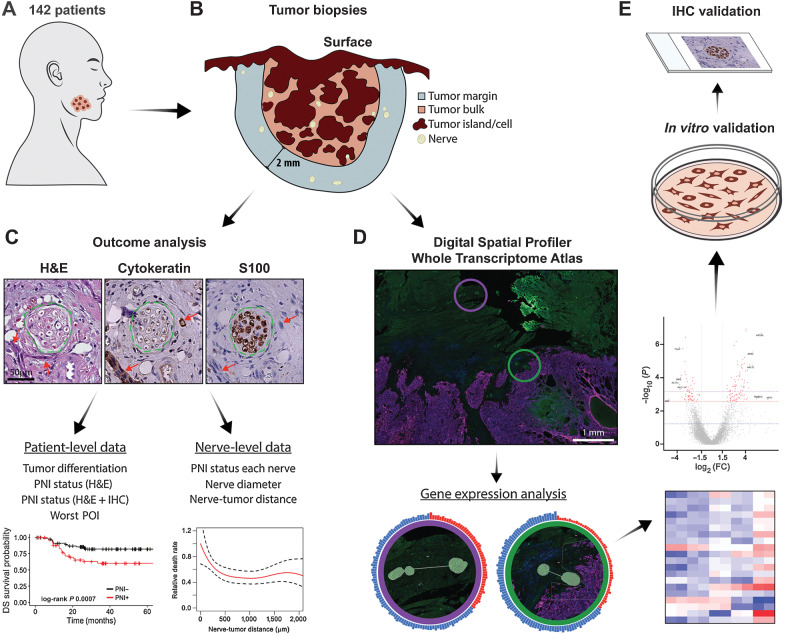
Figure 1.
Schematic summary of study design. A, Cohort of 142 patients with OSCC. B, Tumor biopsy samples were serially sectioned. All nerves in the tumor bulk and in a 2 mm margin around the tumor bulk were assessed. C, H&E, cytokeratin, and S100 stains were used to locate tumor cells and nerves. Green dashed lines show the nerve outline and red arrows indicate tumor cells. Scale bar, 50 μm. Analysis of serial sections generated patient-level and nerve-level data, used for outcome analysis. D, A subset of samples (n = 8) was selected for spatial transcriptomic analysis. Morphology markers for cytokeratin and S100 were used to guide identification of nerve areas in relation to tumor. AOIs for a nerve close to tumor (green circle) and a nerve far from tumor (purple circle) are overlaid in the immunofluorescence image and enlarged below. Tissues were probed for over 18,000 genes; differential gene expression analysis was performed comparing nerves in different areas of the tumor specimen. E,In vitro validation was performed in neuronal and Schwann cells, and rat DRG; IHC validation was performed in patient tissue specimens.

