. 2022 May 26;28(16):3557–3572. doi: 10.1158/1078-0432.CCR-21-4543

Figure 5.

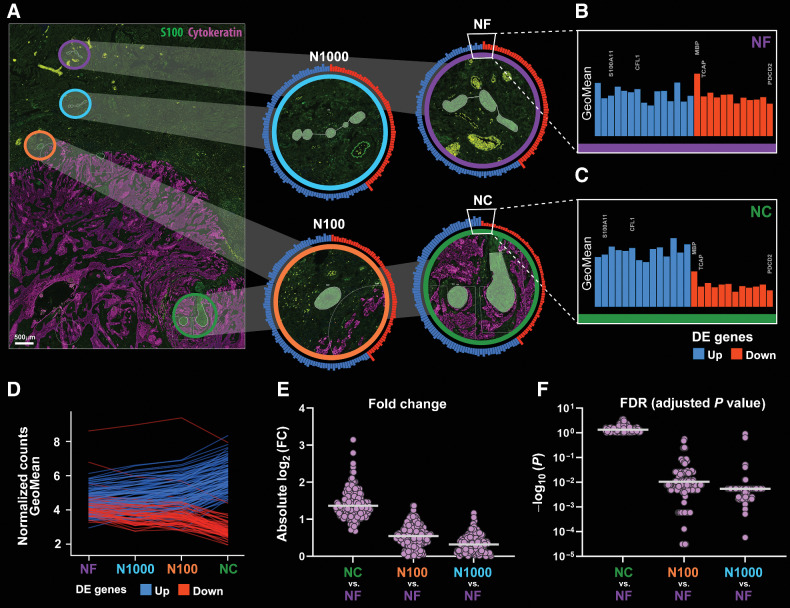
Figure 5. Transcriptomic profile of nerves varies with nerve-tumor distance. A, Biopsy sections were stained with morphology markers (cytokeratin in purple and S100 in green) for identification of AOIs. AOIs are overlaid in the fluorescence image and enlarged in panels at right: NC (within 100 μm from tumor with at least 50% surrounded by tumor cells) is identified in green, N100 (within 100 μm from tumor cells but excluded from NC) in orange, N1000 (nerve between 100 and 1,000 μm from tumor) in light blue and NF (beyond 1,000 μm from tumor) in purple. Circular bar graphs around each enlarged AOI represent log2-transformed normalized gene counts (GeoMeans) of 159 genes that were differentially expressed between NC and NF. Blue bars are upregulated and red bars are downregulated in NC. Enlarged GeoMean bar graphs of NF (B) and NC (C) show differences in gene expression. D, GeoMeans for 159 genes as a function of the type of AOI. Upregulated genes go gradually up whereas downregulated genes go gradually down from NF to NC. Gradual differences are observed for the log2(FC; E) and adjusted P values (FDR; F) for 159 genes as a function of nerve-tumor distance. NC versus NF has the largest log2(FC) and the smallest FDR values, while N1000 versus NF are most similar in terms of gene expression. Scale bar (A), 500 μm.

Transcriptomic profile of nerves varies with nerve-tumor distance. A, Biopsy sections were stained with morphology markers (cytokeratin in purple and S100 in green) for identification of AOIs. AOIs are overlaid in the fluorescence image and enlarged in panels at right: NC (within 100 μm from tumor with at least 50% surrounded by tumor cells) is identified in green, N100 (within 100 μm from tumor cells but excluded from NC) in orange, N1000 (between 100 and 1,000 μm from tumor) in light blue, and NF (beyond 1,000 μm from tumor) in purple. Circular bar graphs around each enlarged AOI represent log2-transformed normalized gene counts (GeoMeans) of 159 genes that were differentially expressed between NC and NF. Blue bars are upregulated and red bars are downregulated in NC. Enlarged GeoMean bar graphs of NF (B) and NC (C) show differences in gene expression. D, GeoMeans for 159 genes as a function of the type of AOI. Upregulated genes go gradually up whereas downregulated genes go gradually down from NF to NC. Gradual differences are observed for the log2(FC; E) and adjusted P values (FDR; F) for 159 genes as a function of nerve-tumor distance. NC versus NF has the largest log2(FC) and the smallest FDR values, while N1000 versus NF are most similar in terms of gene expression. Scale bar (A), 500 μm.