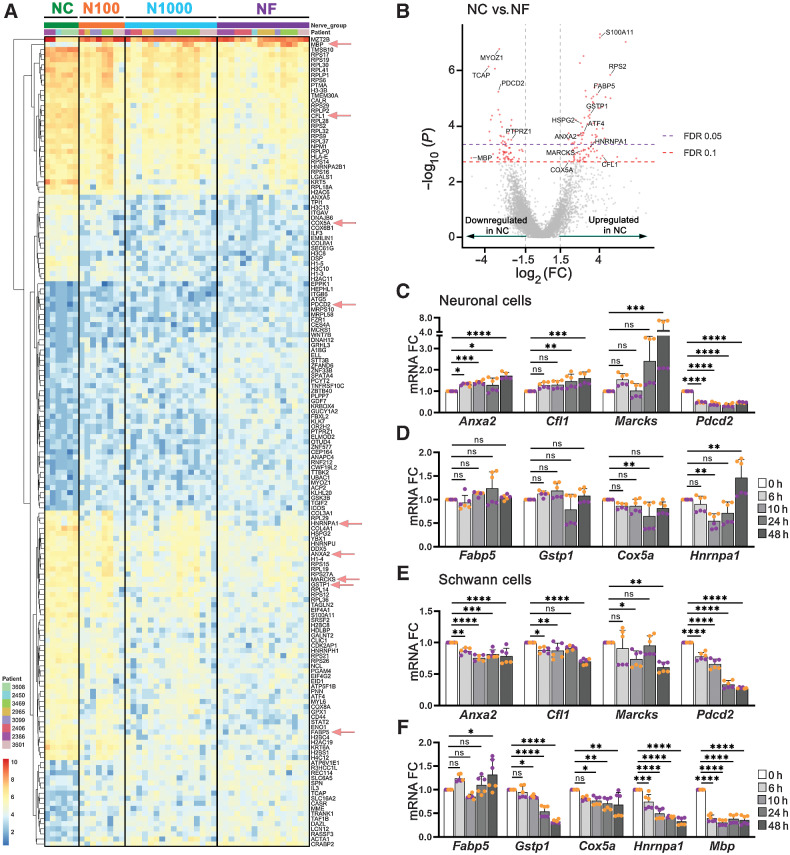
Figure 6.
DEGs in nerves close to and far from tumor. A, Heatmap of 46 AOIs across 8 patients, showing 159 significant (FDR ≤ 0.1) differentially expressed genes in NC versus NF. Each row of the heatmap represents the transformed log2 values of one DEG across all samples (blue, low expression; red, high expression). AOI types are identified on top. Genes selected for in vitro validation (C–F) are highlighted with red arrows. B, Volcano plot of differentially expressed genes, identified in red. FDR ≤ 0.05 and ≤ 0.10 are identified by dashed lines. C and D, 50B11 neuronal cells were treated with conditioned medium from cancer cells (UM-SCC-29) for up to 48 hours and mRNA expression of selected genes was assessed. E and F, S16 Schwann cells were treated as described in C and D. Each color represents an independent experiment in C, D, E, and F. Timepoints are depicted in shades of gray. (One-way ANOVA P values: * < 0.05; ** < 0.01; *** < 0.001; **** < 0.0001).

