. 2022 May 26;28(16):3557–3572. doi: 10.1158/1078-0432.CCR-21-4543

Figure 7.

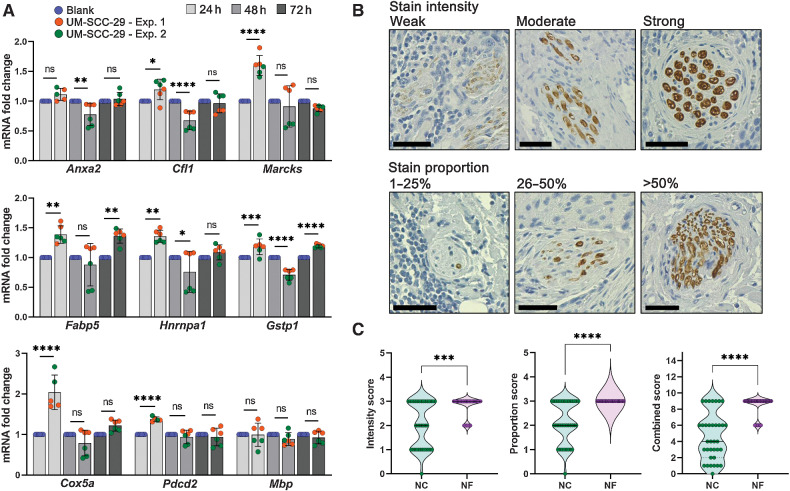
Figure 7. Validation of DEGs in nerves close to cancer. A, DRG from rat were cocultured for the designated timepoints in the presence or absence of UM-SCC-29 cells; mRNA expression of selected genes was measured. Timepoints are depicted in shades of gray. (One-way ANOVA P values: * < 0.05; ** < 0.01; *** < 0.001; **** < 0.0001). B and C, IHC for MBP; nerves close to (NC, n = 35) and far from tumor (NF, n = 40) were scored for intensity and proportion of stain, and a combined score (intensity × proportion) was generated. Scale bars = 50 μm; n = 8 patients. Quantification is shown in C (Mann–Whitney test P values: *** < 0.001; **** < 0.0001).

Validation of DEGs in nerves close to cancer. A, DRG from rat were co-cultured for the designated timepoints in the presence or absence of UM-SCC-29 cells; mRNA expression of selected genes was measured. Timepoints are depicted in shades of gray. (One-way ANOVA P values: * < 0.05; ** < 0.01; *** < 0.001; **** < 0.0001). B and C, IHC for MBP; nerves close to (NC, n = 35) and far from tumor (NF, n = 40) were scored for intensity and proportion of stain, and a combined score (intensity × proportion) was generated. Scale bars = 50 μm; n = 8 patients. Quantification is shown in C (Mann–Whitney test P values: *** < 0.001; **** < 0.0001).