
Figure 2.
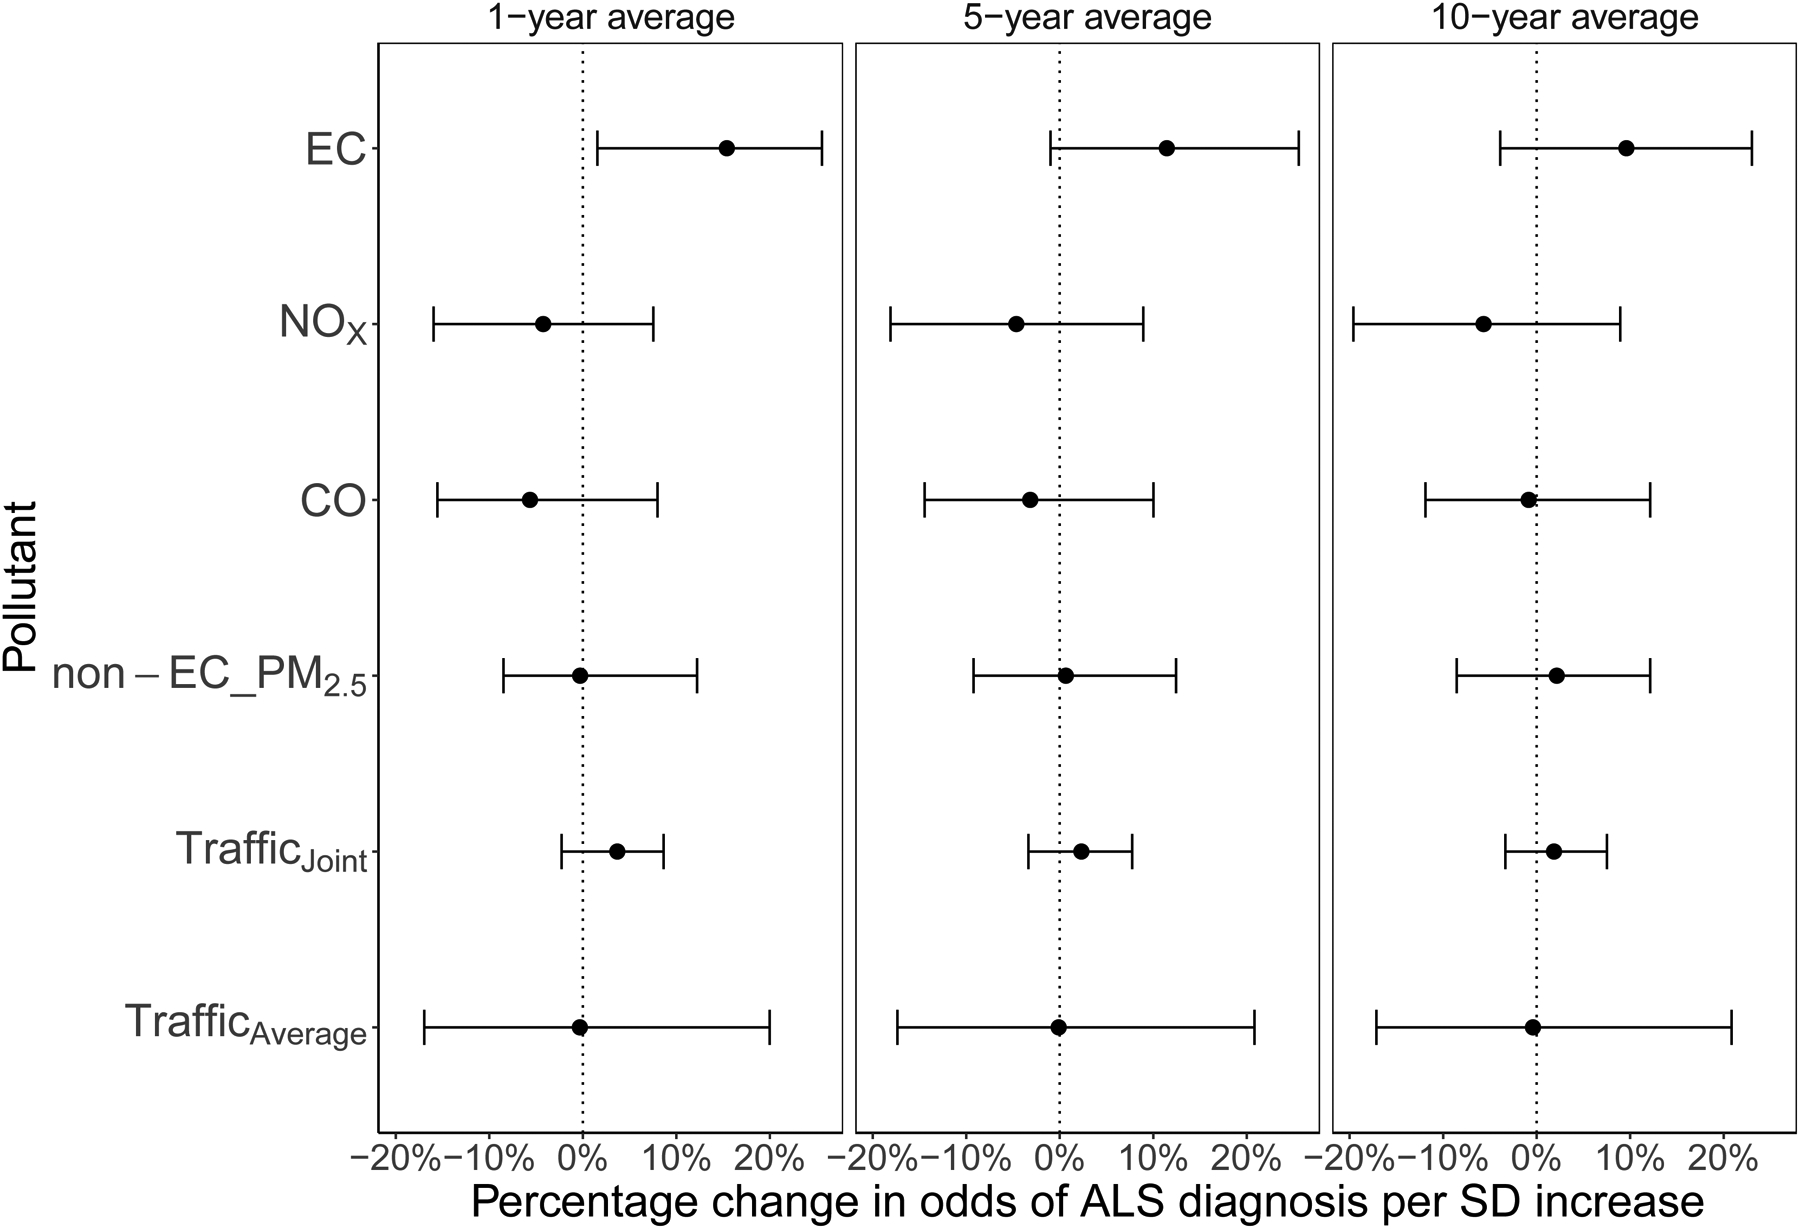
Percentage change in odds of ALS diagnosis per 1-, 5- and 10-year average standard deviation (SD) increase for each pollutant. Results are from the Bayesian hierarchical model including each of elemental carbon (EC), nitrogen oxides (NOx), carbon monoxide (CO), non-elemental carbon fine particles (non-EC PM2.5), and ozone (O3)together, and were additionally adjusted by age, sex, year of birth, vital status, socioeconomic status, civil status, last reported place of residence, and place of birth.