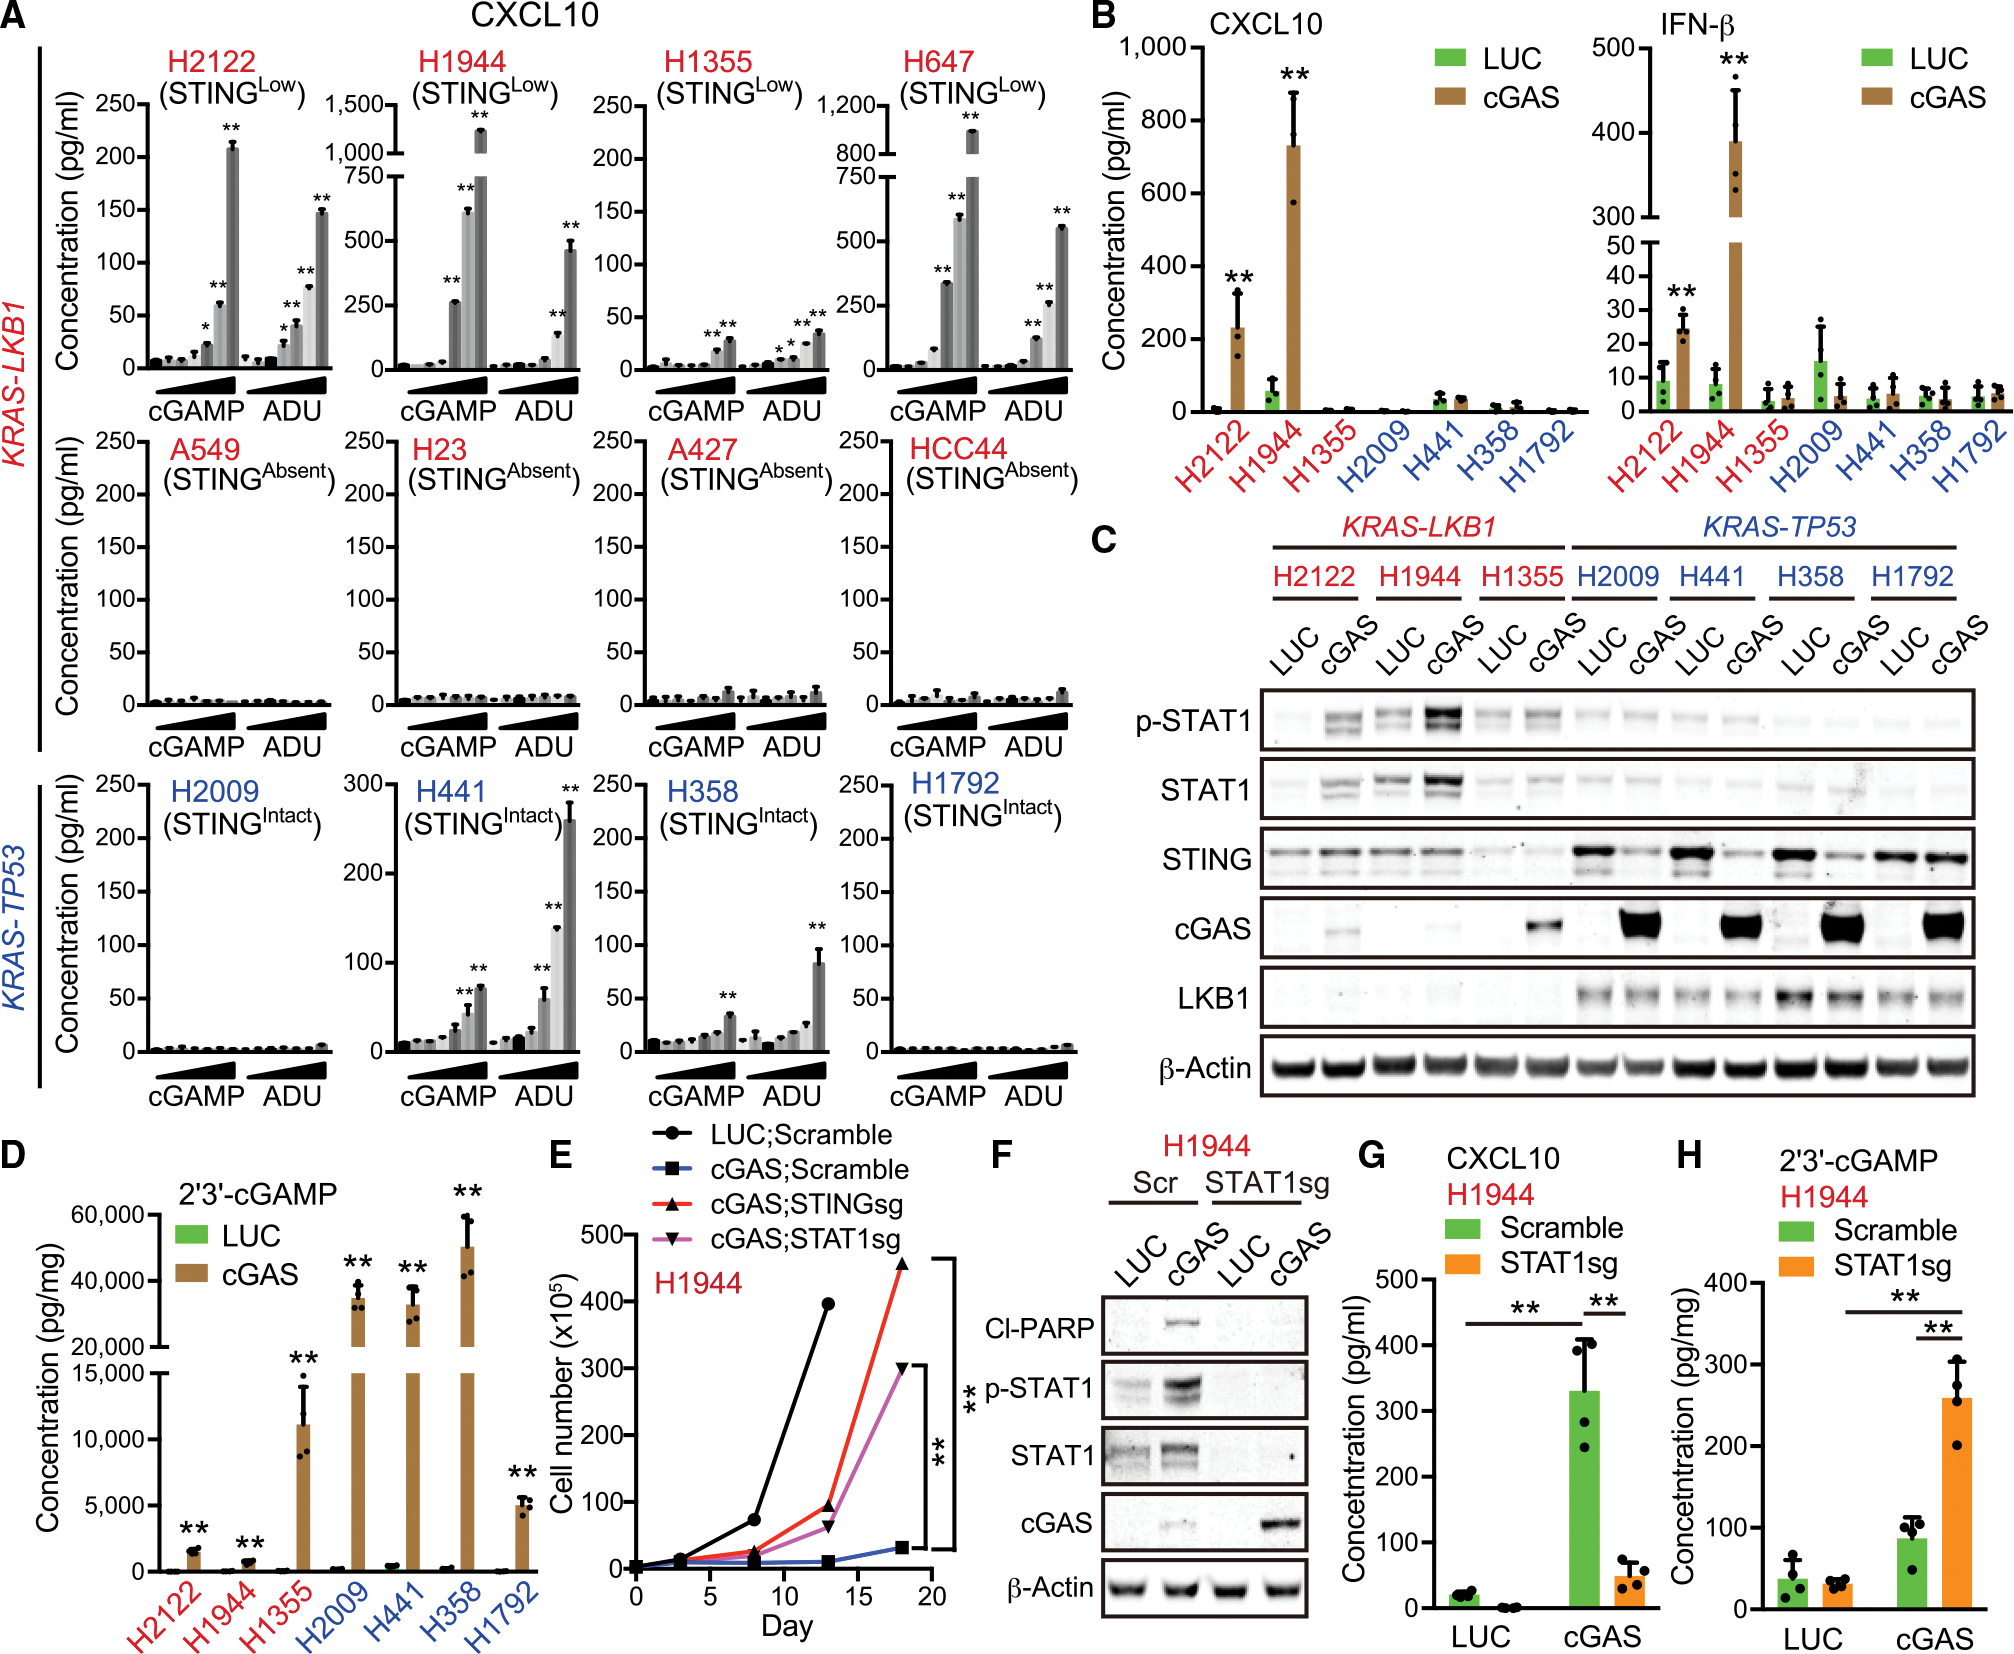
Figure 1. KL cells exhibit low tolerability to accumulation of intracellular 2′3′-cGAMP.

(A) Enzyme-linked immunosorbent assay (ELISA) of human CXCL10 levels in conditioned medium (CM) derived from KL (red) or KP (blue) NSCLC cells treated with or without 3.125, 6.25, 12.5, 25, 50, or 100 μM 2′3′-cGAMP or ADU-S100 for 24 h (n = 3). H2122, H1355, H23, and HCC44 KL cell lines have a p53 mutation.
(B) ELISA of human CXCL10 or IFN-β levels in CM derived from KL or KP cells transduced with the indicated vectors (n = 3).
(C) Immunoblot (IB) of the indicated proteins in KL or KP cells transduced with the indicated vectors.
(D) ELISA of intracellular 2′3′-cGAMP levels in KL (red) or KP (blue) cells transduced with the indicated vectors (n = 4). © Total cell number of H1944 cells transduced with the indicated vectors at each measuring point (day 0, day 3, day 8, day 13, or day 18).
(F–H) IB of the indicated proteins (F), or ELISA of human CXCL10 in CM (G) or intracellular 2′3′-cGAMP levels (H) in H1944 cells transduced with the indicated vectors (n = 4).
All quantitative data are represented as mean ± SD p values were calculated by unpaired two-tailed Student’s t test (B, D, and E), or one-way analysis of variance followed by Dunnet’s post hoc test (A), or two-way ANOVA(G and H) followed by Sidak’s post hoc test (G and H), *p < 0.05, **p < 0.01. See also Figure S1.
