
Figure 3. MPS1 inhibition induces micronuclei formation and subsequent STING activation in KL cells.
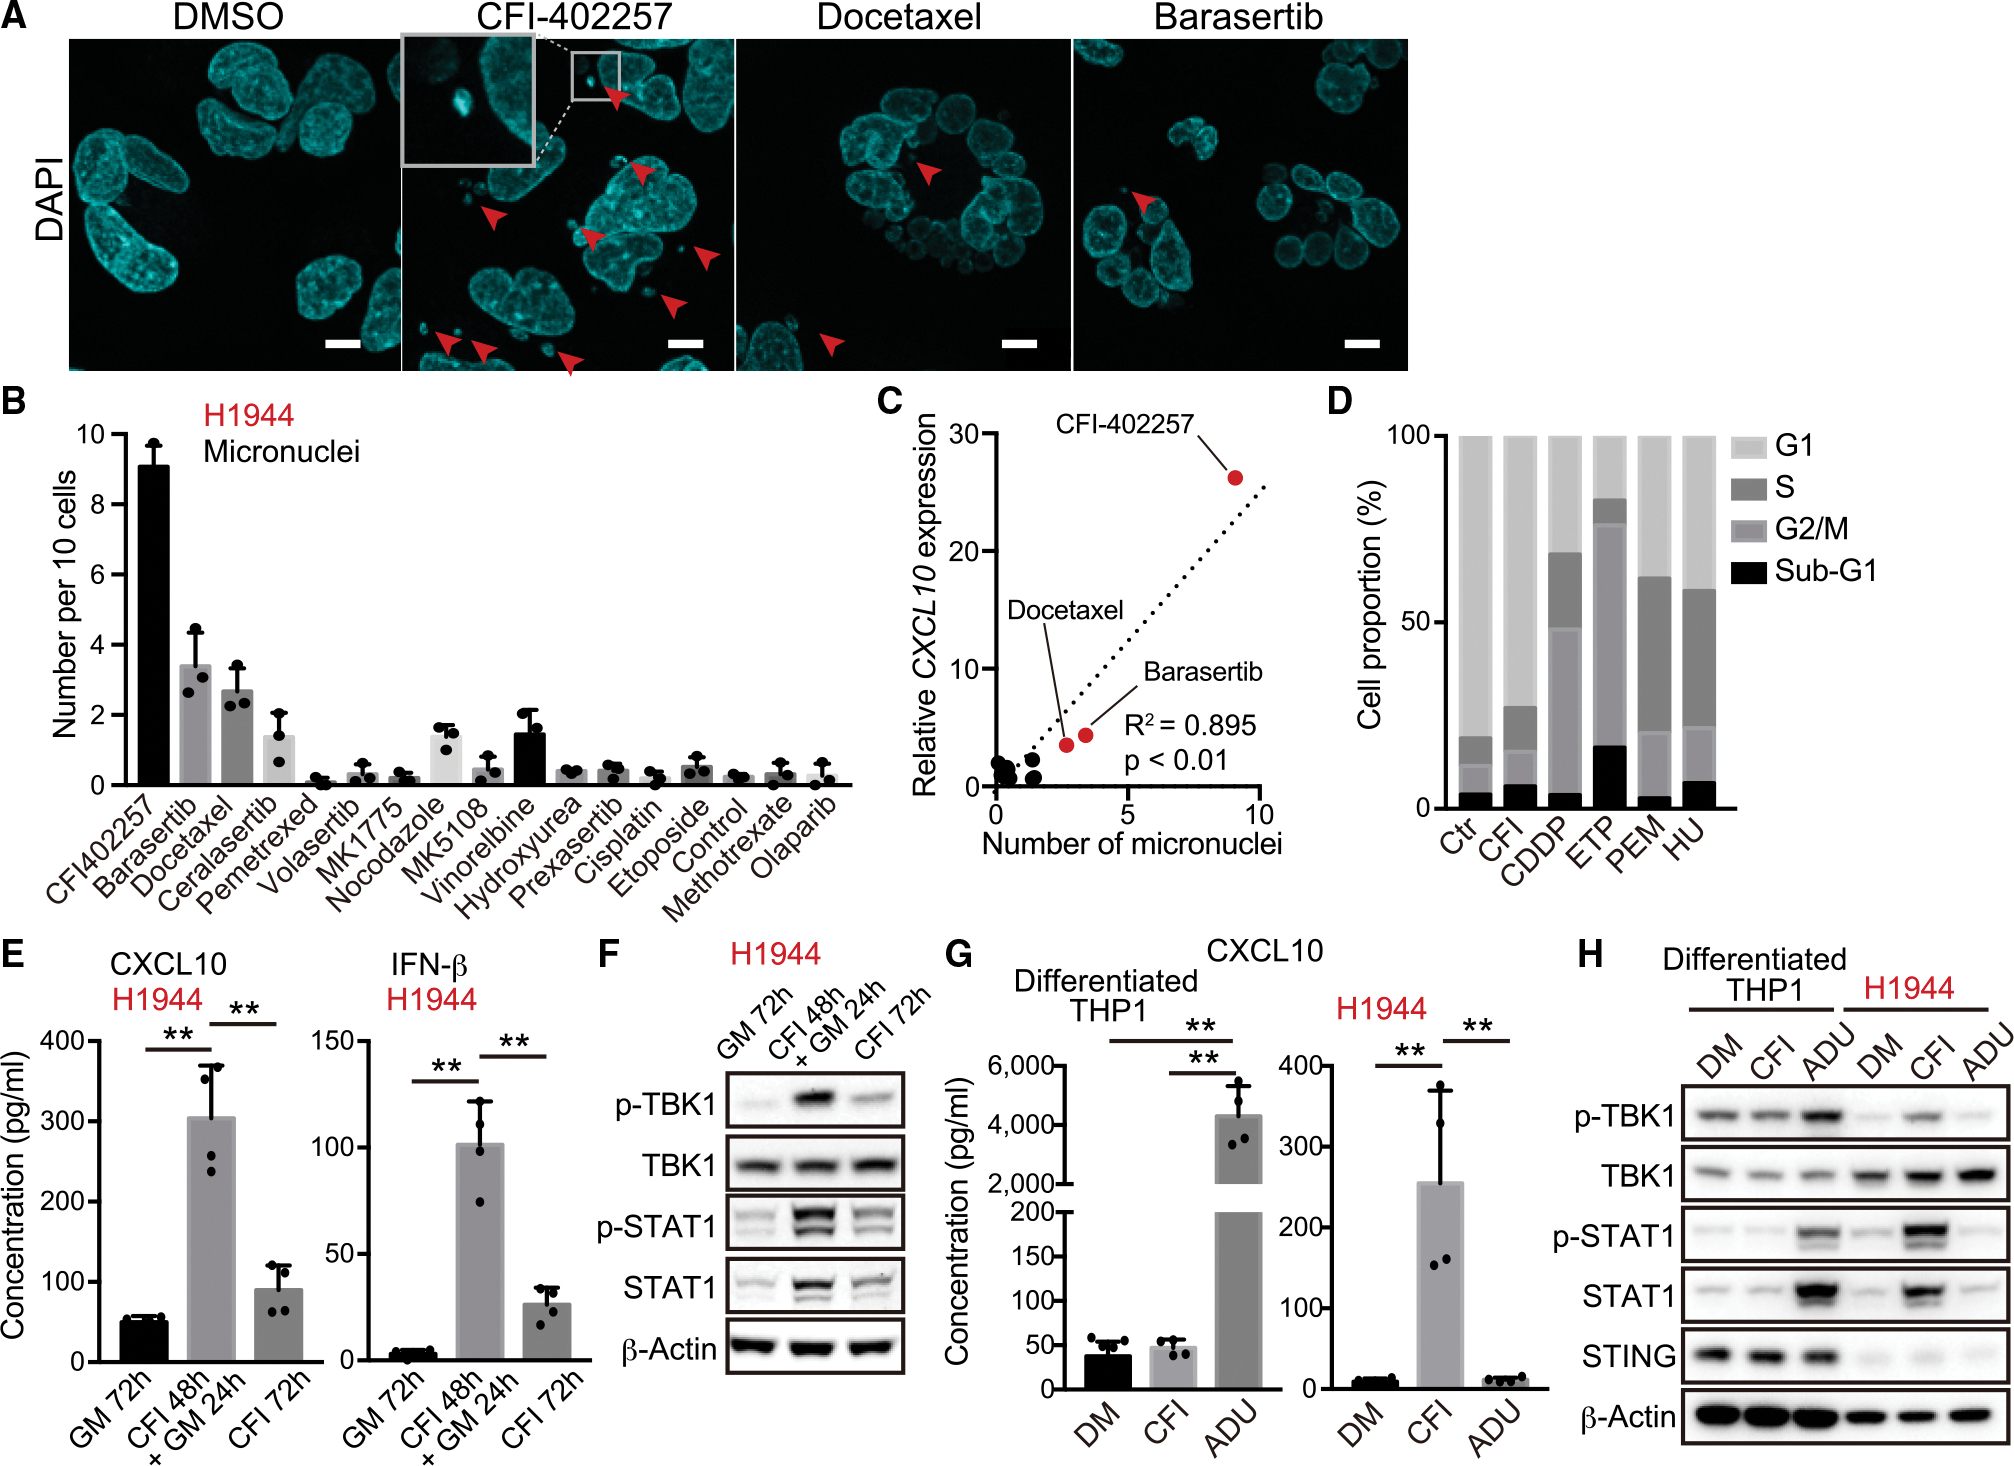
(A) Representative confocal microscope images of DAPI staining in H1944 cells treated with 200 nM CFI-402257, 5 nM docetaxel, or 200 nM barasertib. Arrows indicate micronuclei. Inset highlights micronucleus. Scale bars, 10 μm.
(B) Number of micronuclei in H1944 cells treated with the indicated DNA-damaging agents (n = 3).
(C) Relative messenger RNA (mRNA) expression of CXCL10 (y axis) versus number of micronucleus (x axis) in H1944 cells treated with the indicated DNA-damaging agents. R2 values and p values for the correlation (Pearson’s r correlation) are shown.
(D) Quantification of cell cycle analysis through propidium iodide staining for the cells after treatment with 200 nM CFI-402257 (CFI), 2.5 μM cisplatin (CDDP), 5 μM etoposide (ETP), 500 nM pemetrexed (PEM), or 50 μM hydroxyurea (HU) for 48 h.
(E and F) Enzyme-linked immunosorbent assay (ELISA) of human CXCL10 or IFN-β levels in CM (E), or immunoblot (IB) of the indicated proteins (F) in H1944 cells treated with 200 nM CFI-402257 (n = 4). GM, growth medium.
(G and H) ELISA of human CXCL10 in CM (G), or IB of the indicated proteins (H) in H1944 or THP1 cells treated with 200 nM CFI-402257, or 10 μM ADU-S100 for 24 h (n = 4). THP1 cells were differentiated to macrophages in the presence of 25 nM phorbol 12-myristate13-acetate (PMA) for 48 h.
All quantitative data are represented as mean ± standard deviation; p values were calculated by one-way analysis of variance followed by Tukey’s post hoc test (E and G), **p < 0.01. See also Figure S3.