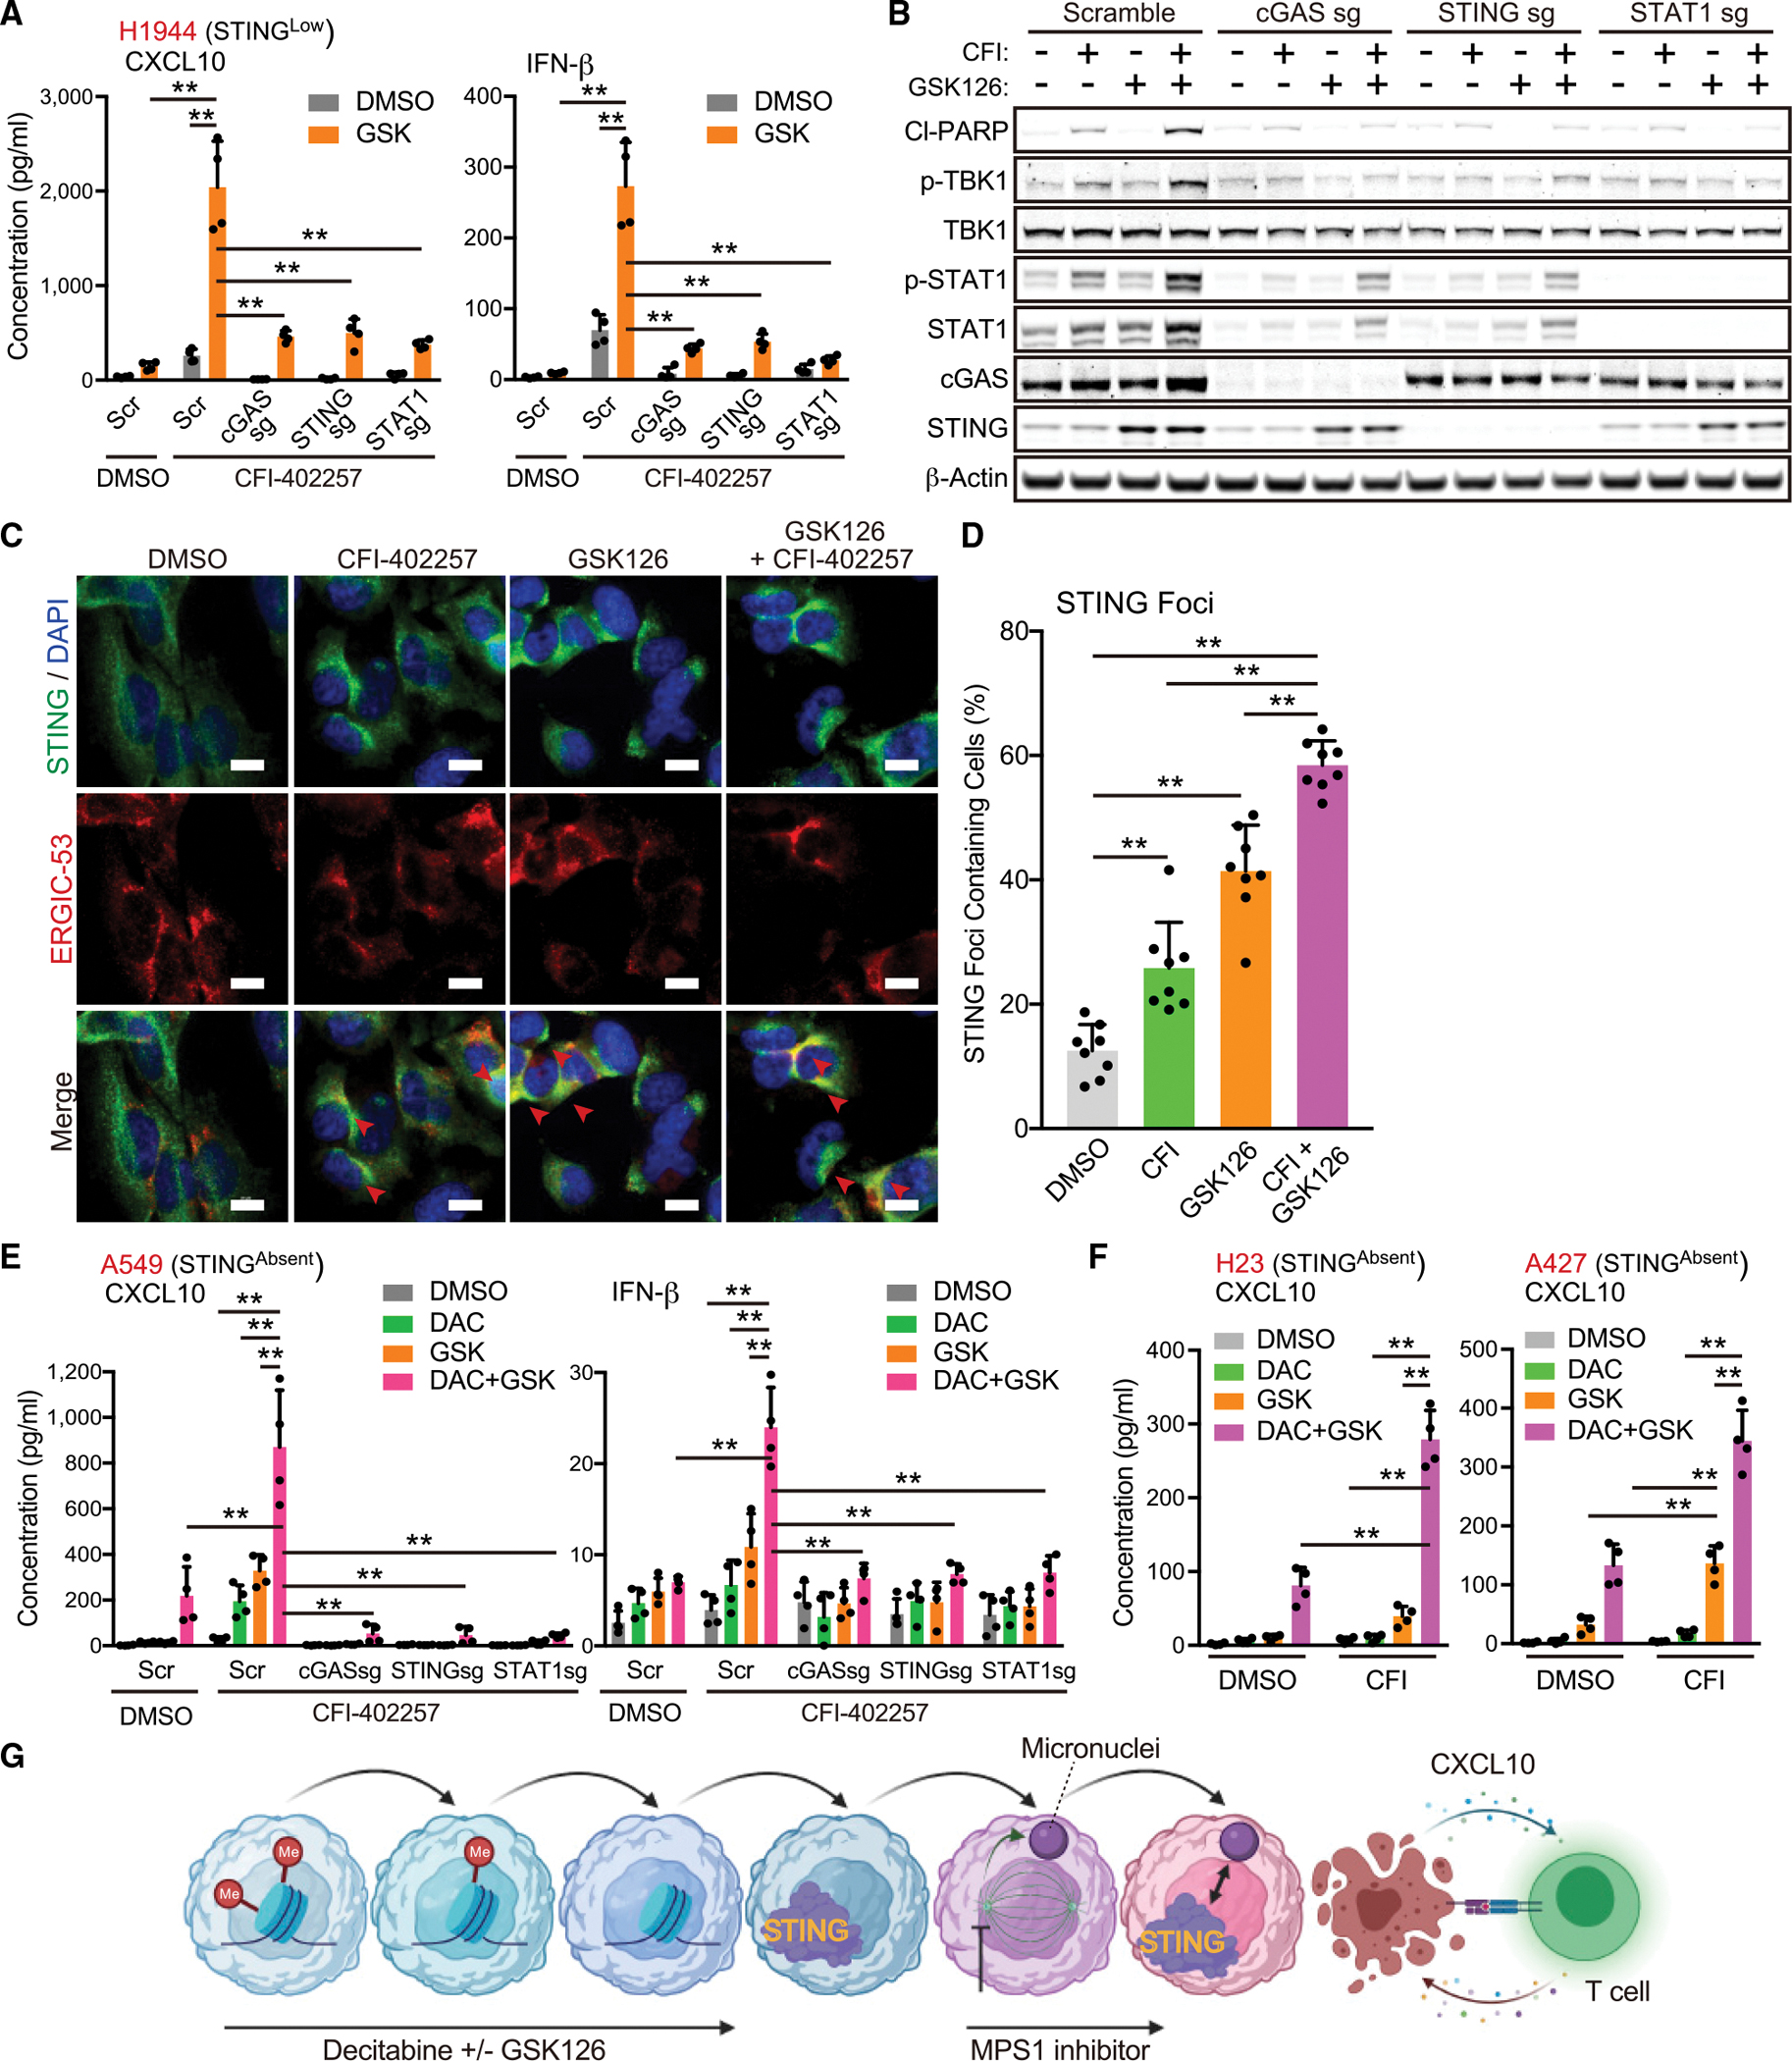
Figure 4. Combination treatment with MPS1 and epigenetic inhibitors cooperatively activate the STING pathway.

(A and B) Enzyme-linked immunosorbent assay (ELISA) of human CXCL10 or IFN-β levels in CM (A), or immunoblot (IB) of the indicated proteins (B) in H1944 transduced with the indicated vectors, and treated with the indicated drugs (5 μM GSK, and/or 200 nM CFI) in accordance with pretreatment schedule (Figure S4A) (n = 4).
(C and D) Fluorescent images (C) and quantification of STING foci containing cells (arrows) (D) in H1944 cells treated with the indicated drugs (5 μM GSK and/or 200 nM CFI) (n = 8). Scale bars, 10 μm.
(E and F) ELISA of human CXCL10 or IFN-β levels in CM derived from A549, H23, or A427 transduced with the indicated vectors, and treated with the indicated drugs (100 nM DAC, 5 μM GSK, and/or 200 nM CFI) (n = 4).
(G) Schematic of the concept of sequential combination therapy with epigenetic inhibitors and MPS1 inhibitor. Schematic is created with BioRender.com.
All quantitative data are represented as mean ± standard deviation; p values were calculated by one-way (D) followed by Tukey’s post hoc test, or two-way (A, E, and F) analysis of variance followed by Sidak’s post hoc test, **p < 0.01. See also Figure S4.
