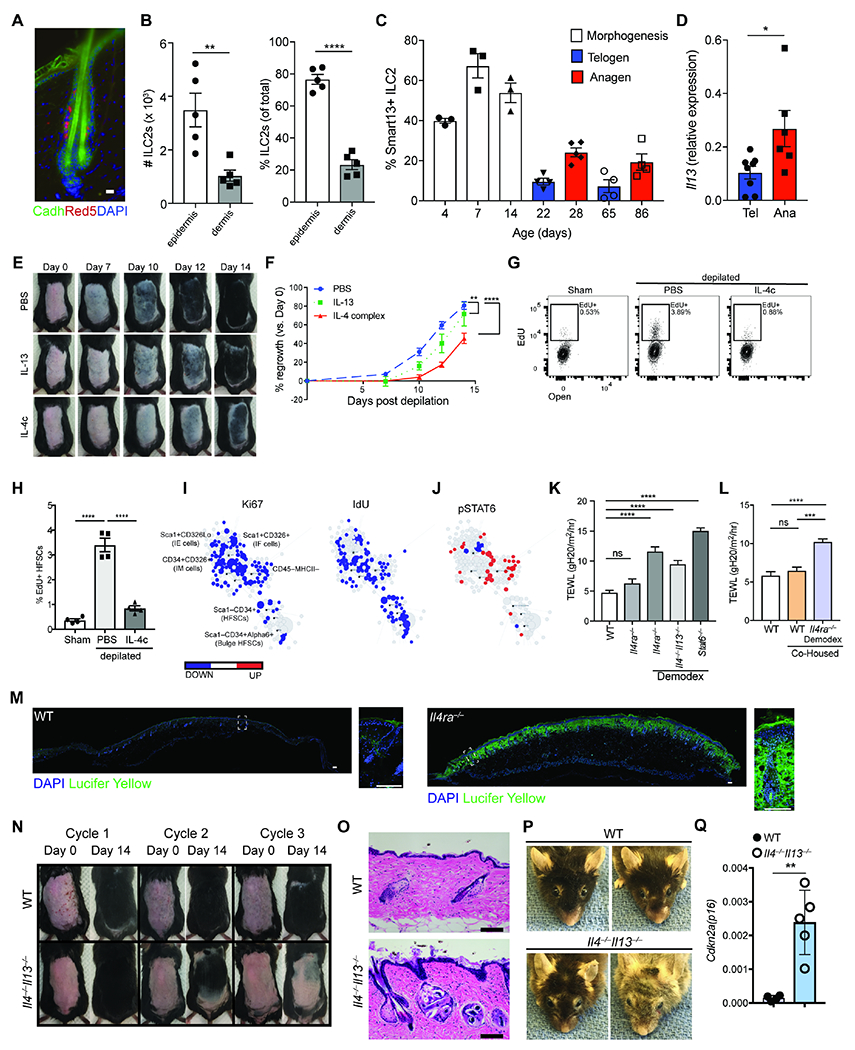
Figure 7. Type 2 immunity sustains skin barrier and HF regeneration after perturbation.

(A) Localization of IL-5 producing ILC2s (red) within the skin epithelium. E-cadherin (green) is used to highlight hair follicles. DAPI is represented in blue. Scale bar, 20 μm. (B) Quantification (left) or percentage (right) of ILC2s (CD45+Lin−Thy1+Red5+) in the epidermis and dermis of adult Il5Red5/+ mice. (C) Quantification of expression of IL-13 by ILC2s throughout the various stages of the hair follicle cycle. (D) Quantitative PCR for Il13 expression by ILC2s (CD45+Lin− Thy1+Red5+) sorted from mice back skin in telogen or anagen stage of the hair cycle. (E) Effect of IL-4 and IL-13 subcutaneous injection in hair growth. Wild type C57BL/6 mice were treated with PBS, IL-13 or IL-4 complex (IL-4c) on the first 2 days after depilation (Days 0 and 1) and their hair regrowth pattern was tracked over 2 weeks. One representative mouse per treatment arm is shown. (F) Quantification of hair regrowth from PBS, IL-4c, or IL-13 treated mice as in (E). (G) Representative flow cytometry panel of hair follicle stem cells (HFSCs, pre-gated as CD45−MHCII−CD34+Alpha6+) incorporation of EdU. Mice were depilated and treated with IL-4 complex (IL-4c) on the first two days after depilation. Mice were harvested on day 4 after depilation. (H) Percent EdU+ HFSCs four days after depilation as in (G). (I) Scaffold maps of Ki67 and IdU for the CD45− epidermal cell fraction as analyzed by CyTOF (see methods). Black nodes represent canonical cell populations identified manually as noted in the top left scaffold map. Blue denotes the population has significant lower expression frequency of the marker (Ki67, or IdU, as denoted in the columns) in the experimental arm (IL-4 complex treated WT mice) vs. WT controls; red denotes significantly higher frequency. n = 4 individual mice per group. (J) Scaffold maps for phospho(p)STAT6 in IL-4 complex treated mice compared to WT controls. Blue and red colors denote statistically significant decrease or increase in expression frequency, respectively, in each cluster compared to the control group (q < 0.05 by SAM). (K) Transepidermal water loss at homeostasis in WT, Il4ra−/− and Demodex-infested Ilra4−/−, Il4−/−Il13−/−, and Stat6−/− mice. (L) Transepidermal water loss at homeostasis in WT or WT mice co-housed with Demodex-infested Il4ra−/− mice. (M) Lucifer yellow barrier assay. WT or Il4ra−/− were shaved and depilated. Two days post-depilation, the epidermal surface was exposed to Lucifer Yellow overnight at 37 °C. Lucifer yellow in green, DAPI in blue. Scale bar, 100 μm. (N) Repeated depilation of wild type (WT) and Il4−/−Il13−/− mice. A representative animal from n = 4 individual mice shown. (O) Sections from back skin of WT and Il4−/−,Il13−/− mice after 3 cycles of depilation were stained with H&E. Scale bar, 100 μm. (P) Representative images of 2 year-old (yo) WT and Il4−/−Il13−/− mice. (Q) qPCR for Cdkn2a(p16) from sorted HFSCs from age-matched 2 yo WT and Il4−/−Il13−/− mice. Data presented as mean ± s.e.m and are representative of at least two independent experiments with n ≥ 3 mice per individual group/time point, pooled from two independent cohorts with n=5-10/group (K, L) or representative from an experiment with n ≥ 4 per group (P, Q). *P < 0.05, **P < 0.01, ***P < 0.001, and ****P < 0.0001 as calculated with two-tailed Student’s t test (A to D, Q) or ANOVA (F, H, K, L).
