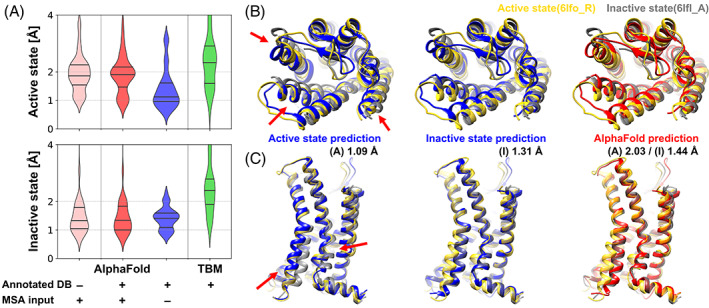
FIGURE 1.

Modeling of active and inactive states of human G‐protein coupled receptor structure (GPCR). (A) Modeling accuracies for human GPCRs that have both active and inactive state experimental structures using various modeling protocols based on AlphaFold and template‐based modeling (TBM). Cα‐RMSDs are measured with respect to active and inactive forms of transmembrane helices. (TM‐RMSD) Distributions of modeling accuracies are shown as violin plots with black lines indicating three quartiles. (B and C) Multi‐state modeling of human C‐X‐C chemokine receptor type 2 (UniProt ID P25025, CXCR2_HUMAN). (B) View from the extracellular region; (C) Side‐view. Models predicted as active and inactive forms using customized GPCR databases via AF2 without MSA input features are shown in blue. A predicted model using AF2 with MSA input features and the standard PDB70 database is shown in red. Experimental structures of active state (yellow, PDB ID 6lfo_R) and inactive state (gray, PDB ID 6lfl_A) are compared to the predictions. Selected conformational differences between states are highlighted by red arrows
