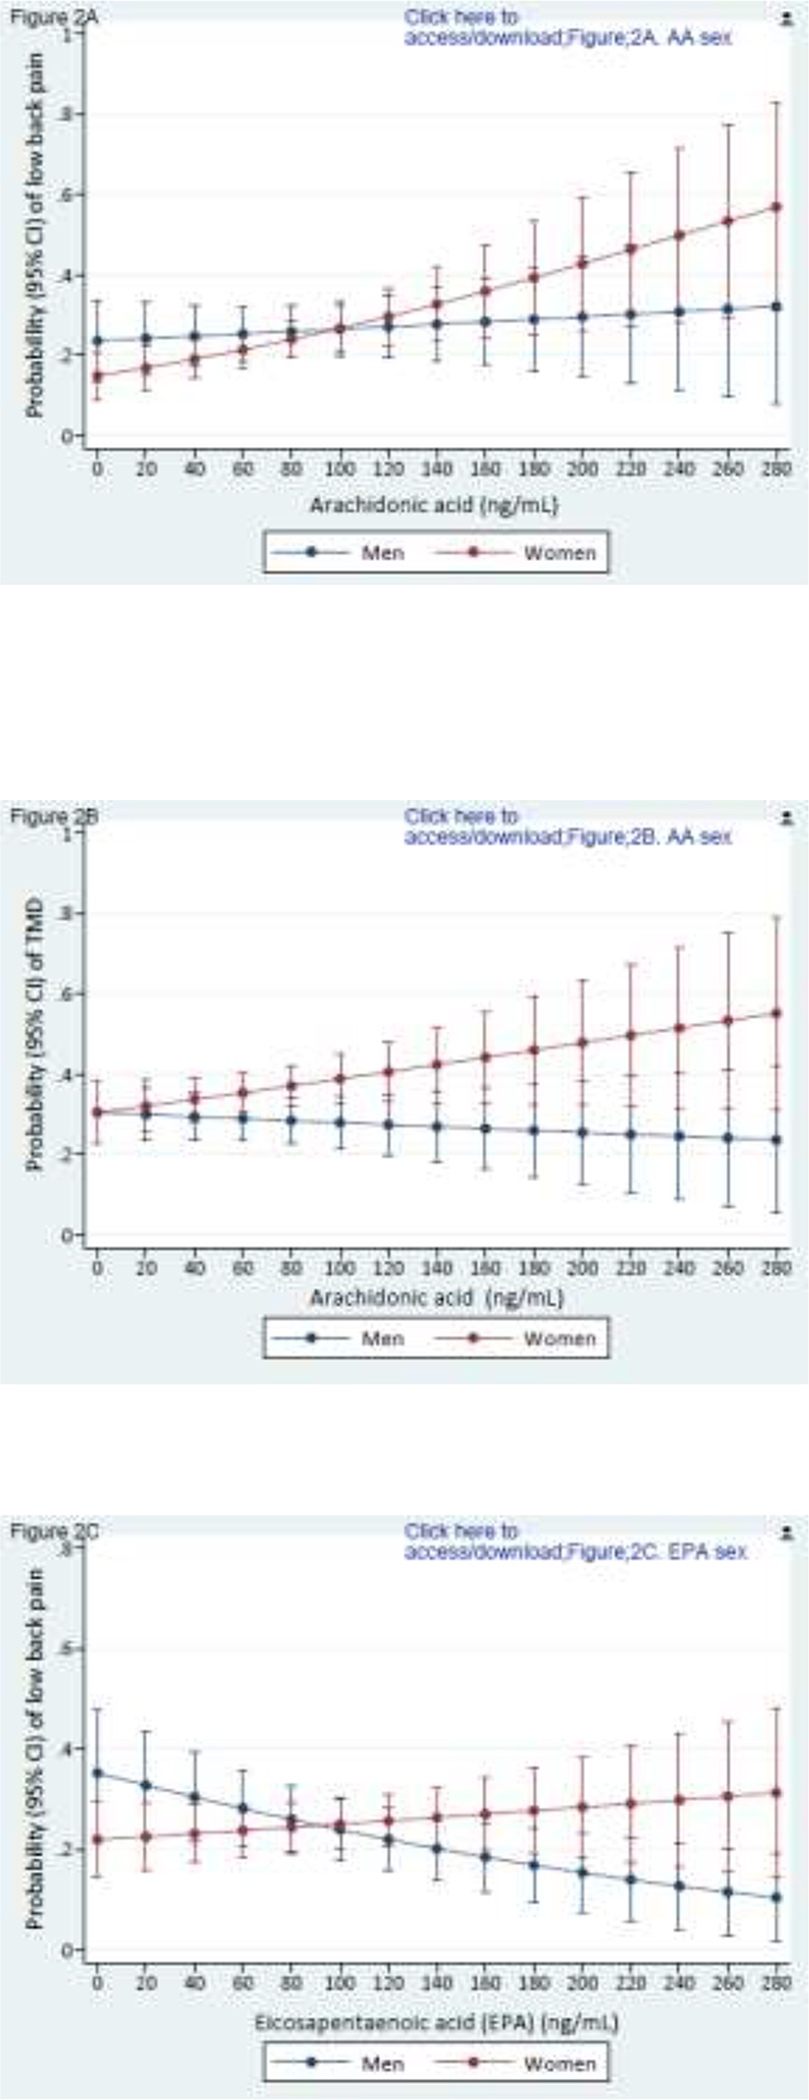
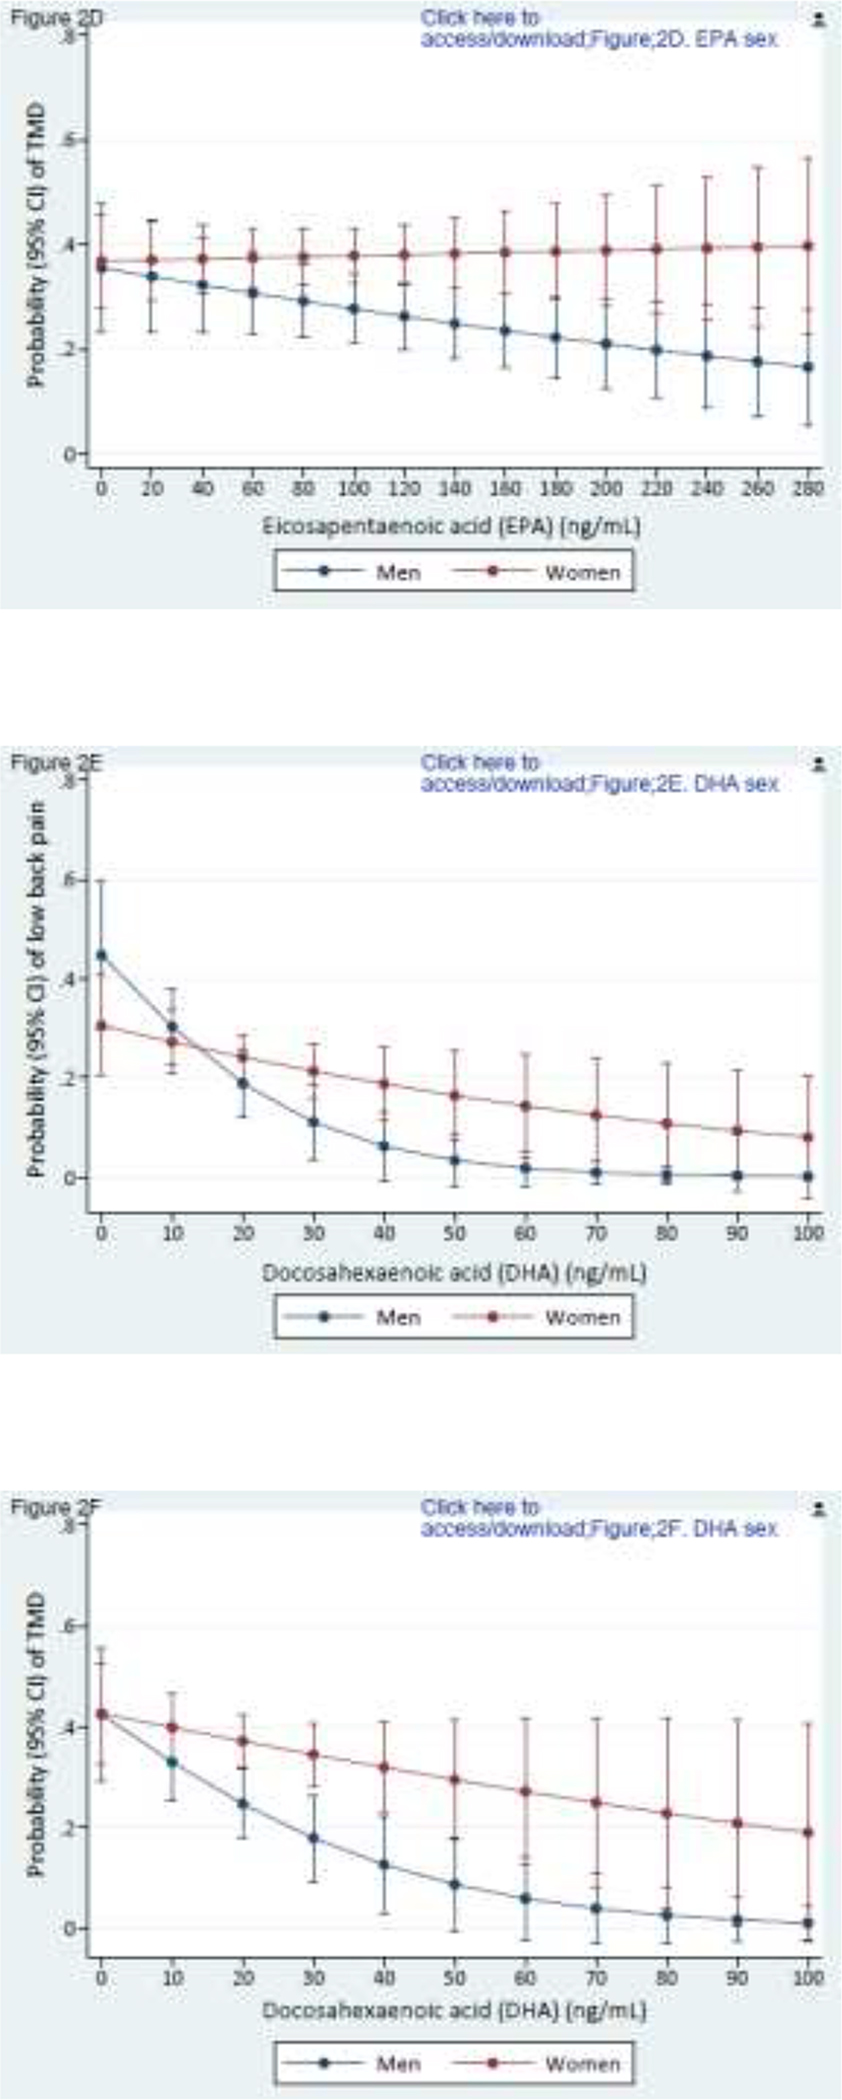
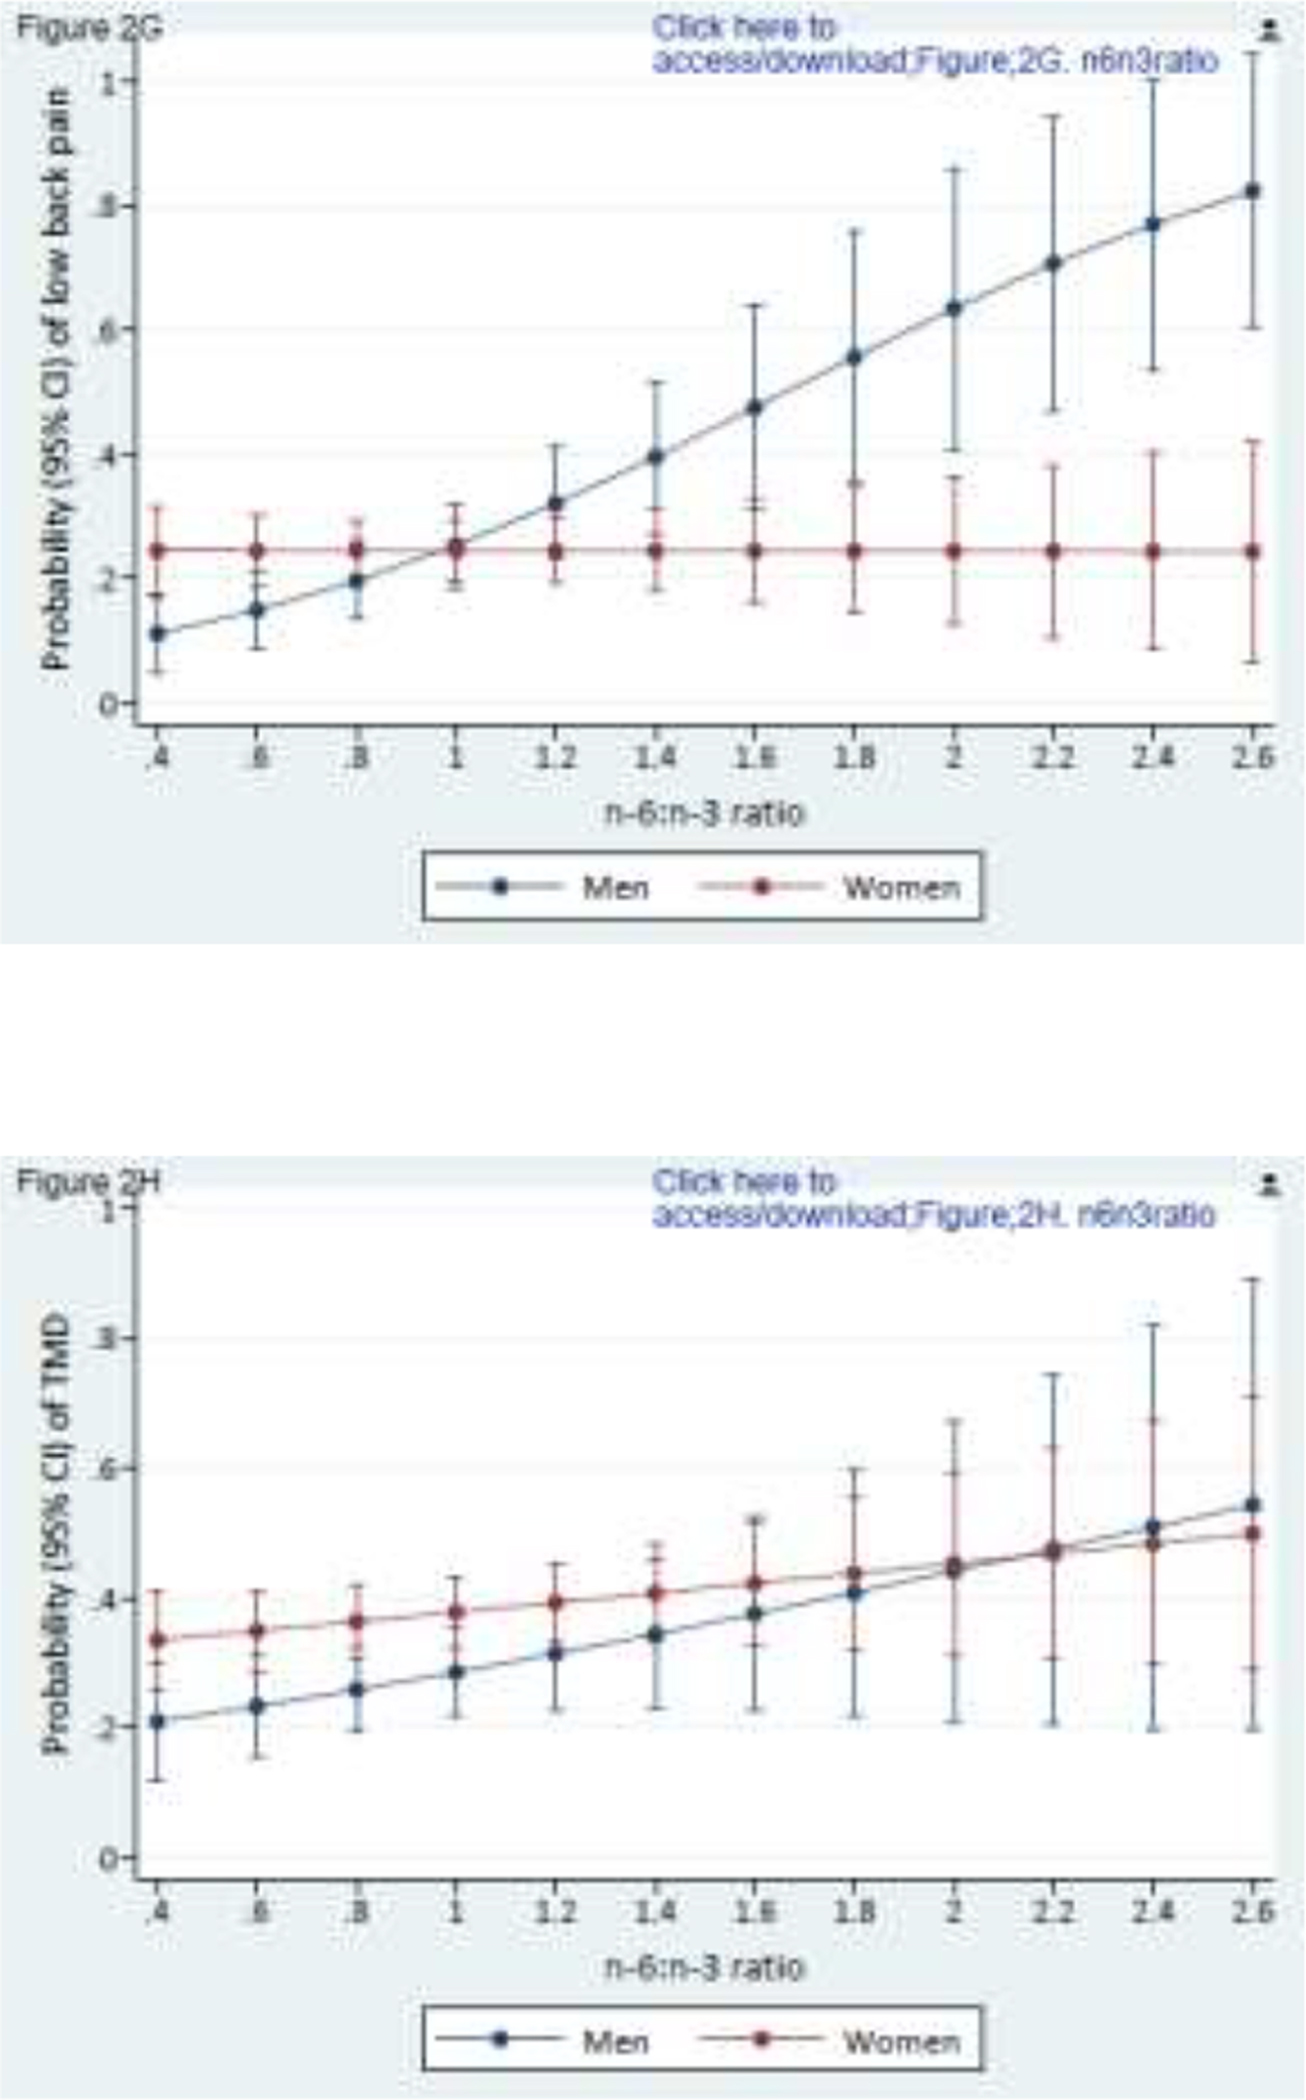
Figure 2.


Composite Figures 2A to 2H report sex differences in the relationships between PUFAs and pain conditions. Values are predicted probabilities of painful temporomandibular disorder (TMD) and low back pain (low back pain) taken from a multivariable logistic regression model, adjusted for linoleic acid and α-linolenic acid (n=503 in all figures).
Figures 2A and 2B depict the relationship of arachidonic acid with TMD pain and low back pain for men and women (P effect modification = 0.065 for TMD; and 0.071 for low back pain, respectively).
Figures 2C and 2D depict the relationship of eicosapentaenoic acid and TMD pain and low back pain for men and women (p effect modification = 0.051 for TMD; and 0.003 for low back pain, respectively).
Figures 2E and 2F depict the relationship of docosahexaenoic acid and TMD pain and low back pain for men and women (p effect modification = 0.048 for TMD; and 0.019 for low back pain, respectively).
Figures 2G and 2H depict the relationship of n-6/n-3 PUFA ratio and TMD pain and low back pain for men and women (p effect modification = 0.173 for TMD; and 0.001 for low back pain, respectively).
