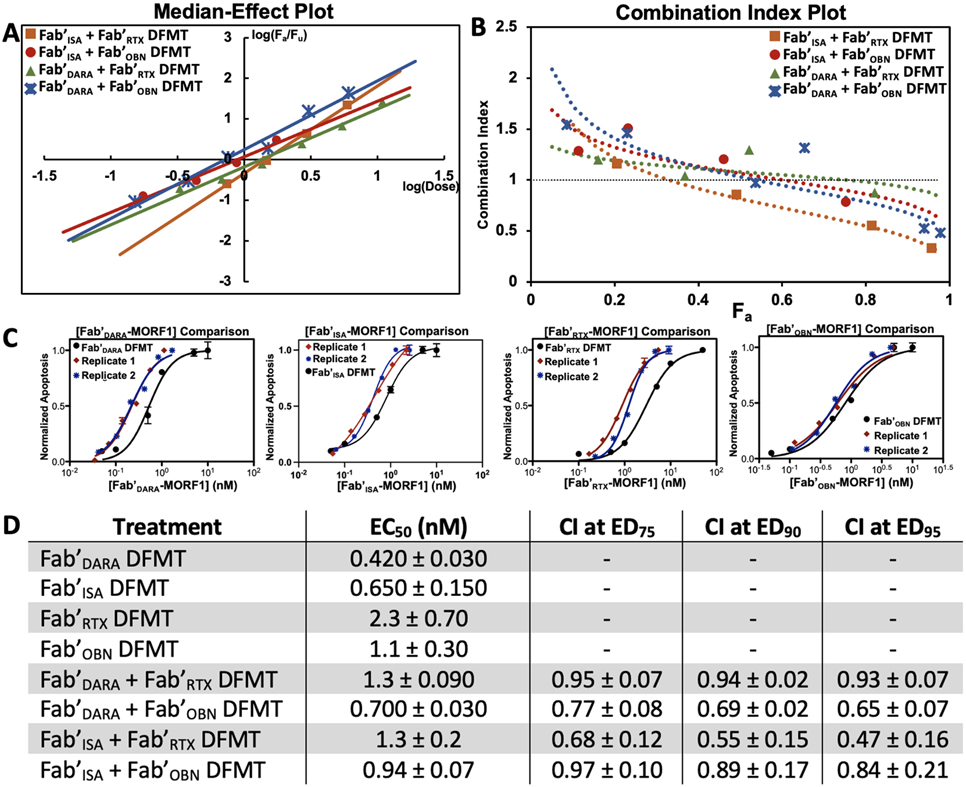
Fig. 4.
Anti-CD20 / anti-CD38 combinational Fab’ DFMT experiments analyzed using Chou-Talalay combination index method. (A) Median-Effect Plot overlay of the four Fab’ DFMT combination cell viability experiments. Data points collected in the sigmoidal region of the combination EC50 plots were plotted as log(Fa/Fu) on the y-axis and log(combined Fab’-MORF1 dose) on the x-axis. Linear regression was used to get a line fit of the data. The x-intercept of the regression curve was taken as the EC50 concentration. (B) Combination Index Plot overlay of the four Fab’ DFMT combination cell viability experiments. Data points from the Median-Effect Plot were converted to Combination Index values using Eq. 1 and plotted against Fa. Combination Index values at 75% Effective Dose, 90% Effective Dose, and 95% Effective Dose are reported and found to be <1, indicating synergism. (C) Representative EC50 plots overlayed with individual Fab’ DFMT and combination Fab’ DFMT with dose of identified Fab’-MORF1 on the x-axis. (D) Tabulated EC50 values for individual Fab’ DFMT systems and combination Fab’ DFMT systems in nanomolar. Combination Index values at ED75, ED90, and ED95 are reported for each of the four Fab’ DFMT combination systems. All experiments were performed in triplicate and in two replicates. The average and standard deviation of the two replicates is reported.

