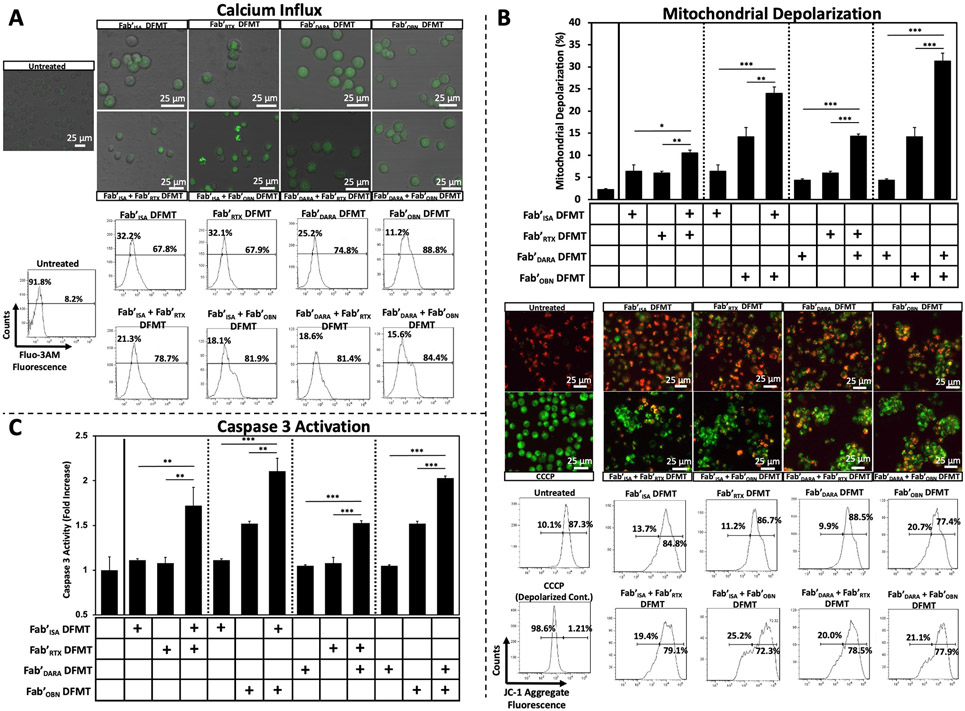
Fig. 5.
Various Type I monoclonal antibody apoptosis mechanisms of action assays for Raji cells treated with single-target Fab’ DFMT systems and heteroreceptor DFMT systems. (A) Calcium influx quantification of single-target DFMT systems compared to heteroreceptor DFMT systems (Top of Panel A). Confocal microscopy images of Raji cells preloaded with calcium indicator Fluo-3 AM indicator. Cells were treated with various DFMT systems for 1 h, washed and imaged to compare qualitative fluorescence intensities (Bottom of Panel A). Flow cytometry histograms of Fluo-3 AM fluorescence of Raji cells treated with the indicated DFMT systems. Untreated cells were gated for background fluorescence. Histogram shifts from untreated were recorded. (B) Mitochondrial membrane depolarization quantification using JC-1 red/green fluorescence. Fluorescence intensities of Raji cells treated with various Fab’ DFMT treatments were quantified with flow cytometry (upper bar graph and lower histogram data) and imaged using confocal microscopy (middle of panel B). Positive membrane depolarization control was performed by treated cells with CCCP to depolarize mitochondrial membranes completely. Homotypic cell adhesion is visible in heterocrosslinked images. (C) Caspase 3 activity of Raji cells treated with various Fab’ DFMT therapies was assayed using a PhiPhiLux® kit and quantified using flow cytometry. Flow cytometry histograms of Caspase 3 experiments can be found in Fig. S10. All experiments were performed in triplicate. *** p < 0.001, ** p < 0.01, *p < 0.05, n.s. not significant by One-Way ANOVA and Tukey test.

