Fig. 6.
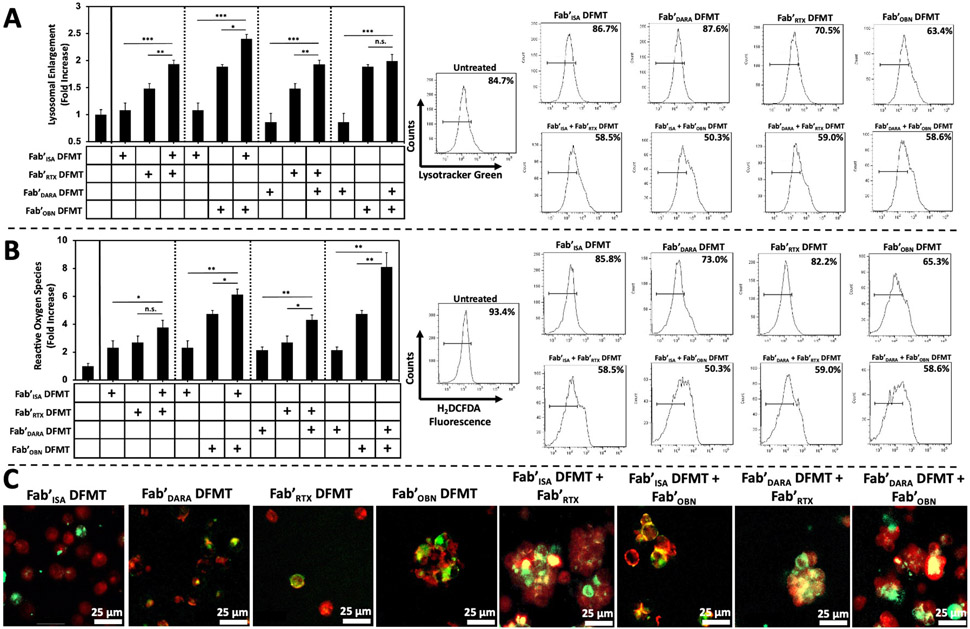
Type II mAb mechanism of action assays. (A) Lysosomal enlargement flow cytometry quantification using LysoTracker Green fluorescence to measure degree of lysosomal involvement in Raji cells treated with single-target DFMT systems compared to combination DFMT systems. Bar graph represents LysoTracker Green fluorescence intensity normalized to untreated cell control. The histograms represent the fluorescence shift increase from untreated control cells. (B) Reactive oxygen species flow cytometry quantification using H2DCFDA oxidation detector in Raji cells treated with single-target DFMT systems compared to combination DFMT systems. Bar graph represents H2DCFDA fluorescence intensity normalized to untreated cell control. The histograms represent the fluorescence shift increase from untreated control cells. (C) Confocal microscopy images of DFMT-treated Raji cells assaying for homotypic cell adhesion comparing single-target Fab’ DFMT to combination Fab’ DFMT systems. DFMT-treated Raji cells were immunostained with Fluor-555 cholera toxin B subunit to label lipid raft aggregation at the interface of aggregated cells. Fluorescently labeled Fab’-MORF1 nanoconjugates were used to confirm presence of receptor-bound Fab’-MORF1 molecules at the interface of aggregated cells (yellow colour indicates overlap of Fab’-MORF1 and lipid raft marker). All experiments were performed in triplicate. *** p < 0.001, ** p < 0.01, *p < 0.05, n.s. not significant by One-Way ANOVA and Tukey test.

