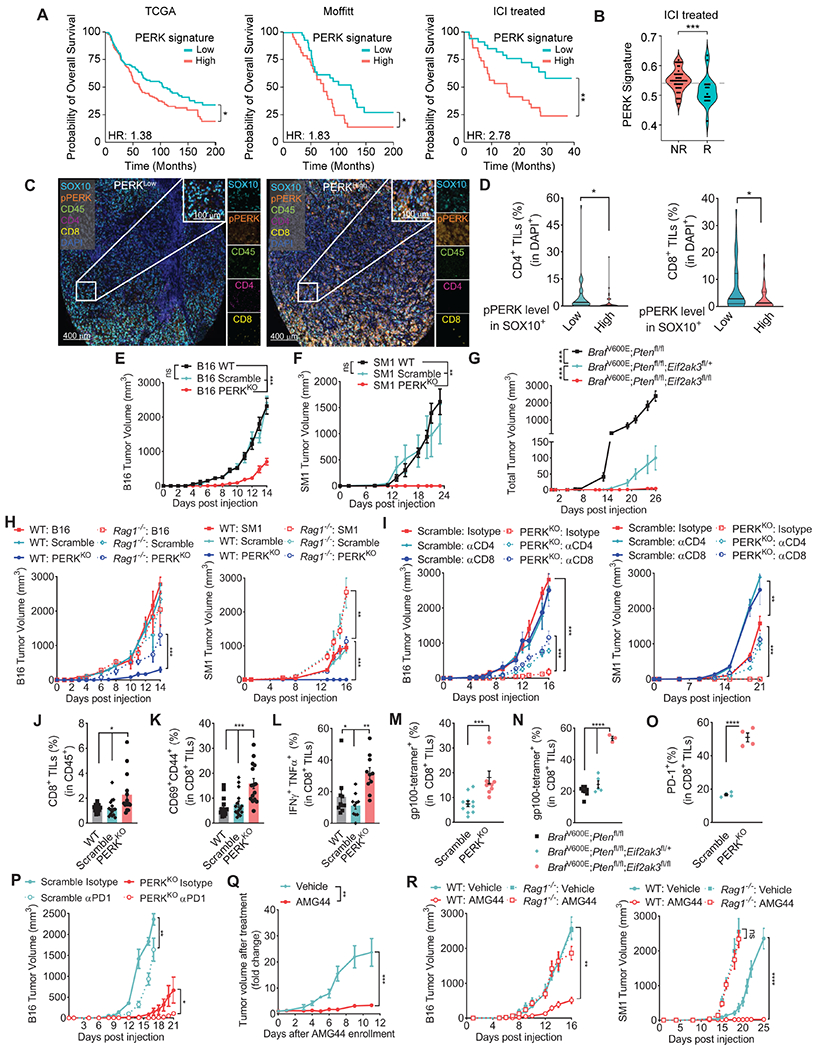
Figure 1: PERK in melanoma cells limits anti-tumor T cell immunity.

(A) Overall survival in melanoma patients from Skin Cutaneous Melanoma datasets (TCGA, Moffitt, and ICI treated) stratified by PERK mRNA signature scores calculated by GSVA. Samples were categorized based on a median split of the signature score: (TCGA: n= 228 above and n= 229 below; Moffitt n=59 above and n= 58 below; ICI treated n=35 above and n=34 below).
(B) PERK signaling score was applied into ICI treated melanoma patients and categorized into Responders (R, n=19) or Non-Responders (NR, n=49) as annotated by the CRI iAtlas portal. Data are the median (gray dashed line) from the min to max and width is the population frequency at that interval.
(C) Illustrative images by Automated Multispectral Imaging (400μm and 100μm) of 133 metastatic melanoma tumors showing SOX10 (Cyan), phospho-PERK (Orange), CD45 (Green), CD4 (Magenta), CD8 (Yellow) and DAPI (Blue). Samples were ranked as PERKhigh or PERKlow as in the Methods.
(D) Proportion of intra-tumor CD4+ (left) and CD8+ (right) T cells in DAPI+ cells in the stratified groups of phospho-PERK in SOX10+ cells from (C). Data are the median (bold horizontal line) ± quartiles (light horizontal line) with n= 33 (Low) and 36 (High).
(E-F) Tumor volume ± SEM in C57BL/6 mice bearing wildtype (WT), Scramble or PERKKO B16 (E, n=29/group), or SM1 (F, n=9/group) tumors.
(G) Total tumor volume ± SEM in tamoxifen-treated Eif2ak3fl/+ or Eif2ak3fl/fl BrafV600E/+;Ptenfl/fl;Tyrosinase-CreERT2 mice vs. BrafV600E/+;Ptenfl/fl;Tyrosinase-CreERT2 mice (n=12/group).
(H) Tumor volume ± SEM of B16, B16 Scramble, and B16 PERKKO cells (left), as well as SM1 counterparts (right) injected into C57BL/6 (Wild Type, WT) or Rag1−/− mice. n=8/group.
(I) Tumor growth ± SEM in mice bearing B16 Scramble or B16 PERKKO tumors (left), or SM1 counterparts (right), treated with isotype, anti-CD4, or anti-CD8. n=5/group.
(J-M) Percentage ± SEM of intra-tumor CD8+ T cells in CD45+ cells (J), and CD69+CD44+ (K), IFNγ+TNFα+ (L), and gp 100-reactive EGSRNQDWL-H-2Db-tetramer+ cells in intra-tumor CD8+ T cells (M) from WT, Scramble and PERKKO B16 tumors at day 17 post-injection. n=10-15/group.
(N) Proportion (mean ± SEM) of EGSRNQDWL-H-2Db-tetramer+ intra-tumor CD8+ T cells from tamoxifen-exposed Eif2ak3fl/+ or Eif2ak3fl/fl BrafV600E/+;Ptenfl/fl;Tyrosinase-CreERT2 mice vs. BrafV600E/+;Ptenfl/fl;Tyrosinase-CreERT2 mice. n=3-8/group.
(O) Proportion ± SEM of CD8+PD-1+ in CD45+ cells from WT, Scramble or PERKKO B16 tumors.
(P) Tumor volume ± SEM in mice bearing Scramble or PERKKO B16 tumors and treated with isotype or anti-PD-1. n=4/group.
(Q) Tamoxifen-exposed BrafV600E/+;Ptenfl/fl;Tyrosinase-CreERT2 mice carrying ~150 mm3 tumors were treated with vehicle or AMG44. Tumor volume normalized to initial treatment volume. n=9/group.
(R) Tumor volume ± SEM in WT and Rag1−/− mice bearing B16 (left) or SM1 (right) tumors and treated after day 6 post-tumor injection with AMG44 (12.5 mg/kg). n=10/group.
Statistics applied using one-way ANOVA (E – L, N, P – R), Student’s t-test (D, M, O), Mann-Whitney t-test (B), or log-rank test (A). *, p<0.05; **, p<0.01; ***, p < 0.001; ****, p < 0.0001. Please also see Figure S1.
