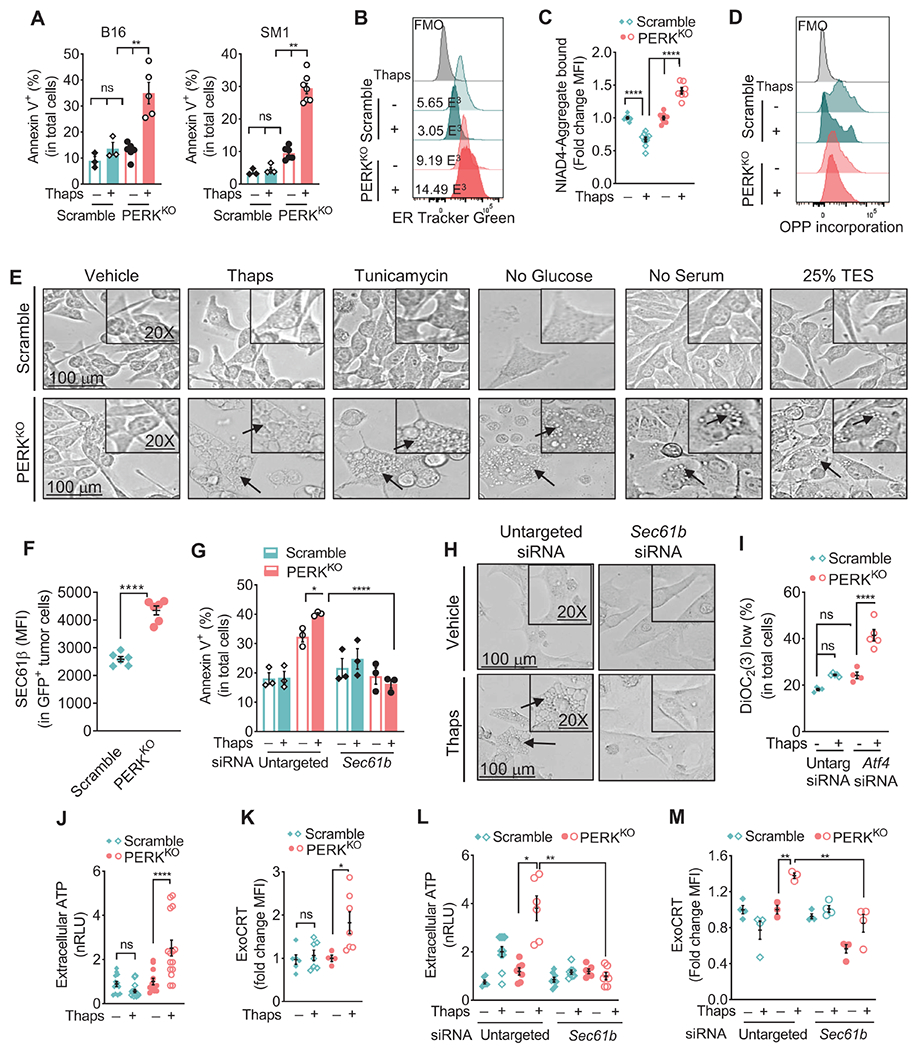
Figure 2: PERK ablation sensitizes melanoma cells to ER stress-induced paraptosis.

(A) Annexin V+ mean percentage ± SEM in Scramble and PERKKO B16 (left) or SM1 (right) tumors cultured for 24 hours with or without Thaps. n=3-7 of 3 independent repeats.
(B) Representative histograms from 3 distinct repeats showing ER Tracker Green in Scramble and PERKKO B16 cells treated as in (A).
(C) Mean fluorescence intensity (MFI) via flow cytometry ± SEM of NIAD4-bound protein aggregates in Scramble and PERKKO B16 cells treated as in (A). n=4-7/group of 3 independent repeats.
(D) Representative histograms from 3 repeats for fluorescent click chemistry-based detection of O-propargyl-puromycin (OPP) incorporation in Scramble and PERKKO B16 cells treated as in (A).
(E) Light microscopy morphology (100μm and 20X digital magnification) of Scramble and PERKKO B16 cells cultured in the presence of vehicle, Thaps, or Tunicamycin; in the absence of Glucose or Serum; or with 25% TES.
(F) SEC61β (MFI ± SEM) in eGFP+ Scramble and PERKKO B16 tumors from mice. n=6/group.
(G) Annexin V+ percentage ± SEM in Scramble and PERKKO B16 cells transfected with untargeted control or Sec61b siRNA and treated as in (A). n=3/group.
(H) Light microscopy morphology in PERKKO B16 cells transfected with mock or Sec61b siRNA prior to Thaps exposure.
(I) Percentage ± SEM of DiOC2 low cells in B16 cells transfected with untargeted or Atf4 siRNA and treated as in (A). n=4-5/group.
(J) ATP in supernatants from Scramble or PERKKO B16 cells incubated or not with Thaps. Data are the normalized relative light units (nRLU) ± SEM of n=12-15/group.
(K) ExoCRT fold change (MFI ± SEM) in Scramble or PERKKO B16 cells cultured as in (A). n=4-7/group.
(L-M) Extracellular ATP (L) and ExoCRT (M) ± SEM in Scramble or PERKKO B16 cells carrying mock or Sec61b siRNA and cultured with or without Thaps. n=6-10/group (L); n=3-4/group (M).
Statistics applied using one-way ANOVA (A, C, F, G, I – M) or Student’s t-test (F), *, p<0.05; **, p<0.01; ****, p < 0.0001. Please also see Figure S2.
