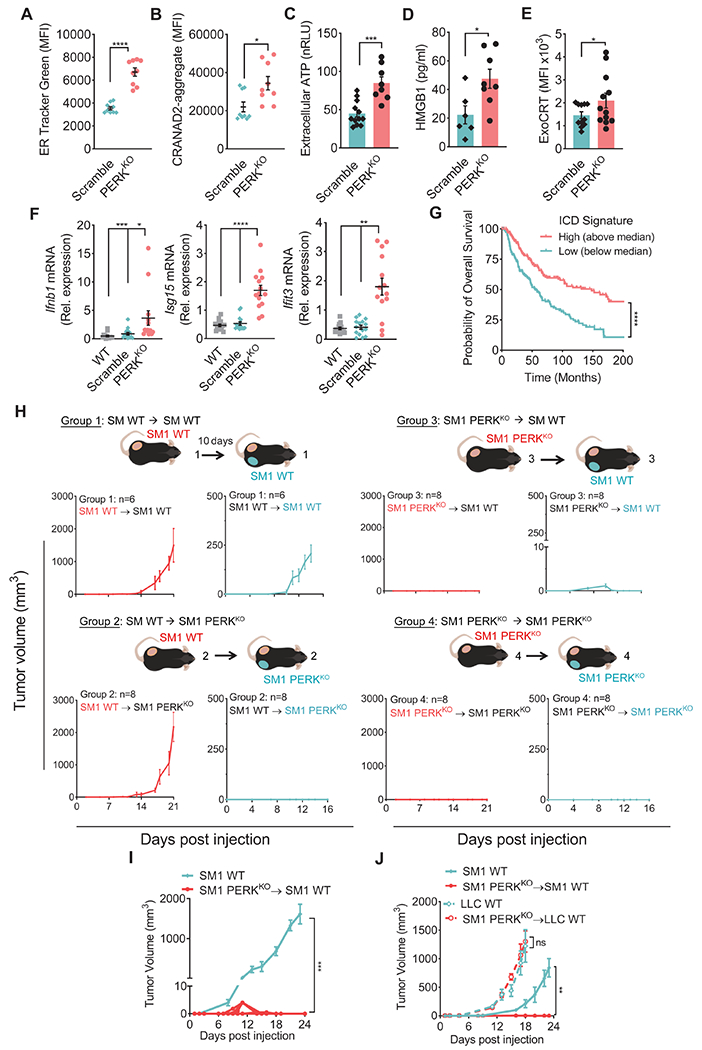
Figure 3: PERK deletion in cancer cells provokes ICD-driven anti-tumor immunity.

(A-B) ER Tracker Green (A) and CRANAD-labeled protein aggregates (B) by flow cytometry (MFI ± SEM) in CD45− cells from Scramble and PERKKO B16 tumors from mice. n=9/group.
(C-D) ATP (C) and HMGB1 (D) (mean ± SEM) in supernatants from resected Scramble or PERKKO B16 tumors cultured for 24 hours. n=8-12/group (C); n=6-8/group (D).
(E) ExoCRT (MFI ± SEM) in CD45− cells from freshly isolated Scramble or PERKKO B16 tumors. n=12/group.
(F) Relative expression of Ifnb1, Isg15 and Ifit3 mRNA ± SEM in bulk wildtype, Scramble or PERKKO B16 tumors from mice. n=13-15/group.
(G) Overall survival for Skin Cutaneous Melanoma patients (TCGA, PanCancer Atlas) stratified by the median ICD metagene signature score. Kaplan-Meier curves of overall survival for ICD high (above the median; n = 228) and low (below the median; n = 229). Gene signature calculation by GSVA.
(H) Mice injected with WT SM1 tumors on the left flank for 10 days later, were implanted with WT (Group 1) or PERKKO (Group 2) SM1 cells on the right flank. Mice were injected with SM1 PERKKO cells on the left flank, followed by injection 10 days later with WT (Group 3) or PERKKO (Group 4) SM1 tumors on the right flank. Tumor growth ± SEM. n=10/group.
(I) WT SM1 tumor growth ± SEM in naïve mice or mice that had rejected PERKKO SM1 tumors. n=10/group.
(J) Volume ± SEM for SM1 (left flank; SM1 WT) and LLC (right flank; LLC WT) tumors in naïve mice and mice that previously rejected PERKKO SM1 tumors. n=5/group.
Statistics applied by one-way ANOVA (F, I, J), Student’s t-test (A – E), or log-rank test (G). *, p<0.05; **, p<0.01; ***, p < 0.001; ****, p < 0.0001. Please also see Figure S3.
