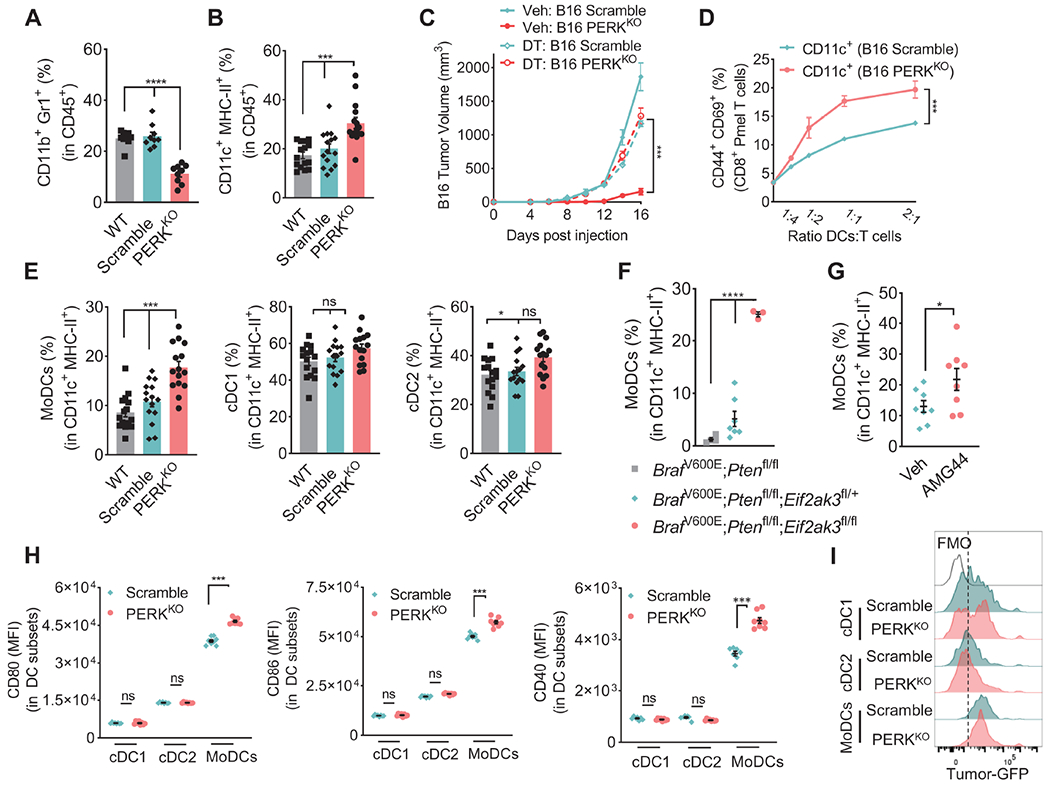
Figure 4: PERK in cancer cells regulates accumulation of MoDCs.

(A-B) Percentage of CD11b+Gr1+ (A) and CD11c+MHC-II+ (B) cells ± SEM in CD45+ cells in tumors from mice bearing wildtype (WT), Scramble or PERKKO B16 tumors for 17 days. n=9/group (A); n=15/group (B).
(C) Volume ± SEM of Scramble and PERKKO B16 tumors implanted into ItgaxDTR/EGFP mice treated with vehicle or diphtheria toxin. n=8/group.
(D) Percentage of CD44+CD69+ ± SEM in CD8+ Pmel T cells co-cultured for 48 hours with sorted CD11c+ cells from Scramble or PERKKO B16 tumors (ratio 1:1/4). n=3/group.
(E) Proportion ± SEM of MoDCs, cDC1, and cDC2 in CD11c+MHC-II+ cells from WT, Scramble, or PERKKO B16 tumors. n=15/group.
(F-G) MoDCs percentage ± SEM within CD11c+MHC-II+ cells in tumors from tamoxifen-treated Eif2ak3fl/+ or Eif2ak3fl/fl BrafV600E/+;Ptenfl/fl;Tyrosinase-CreERT2 mice vs. BrafV600E/+;Ptenfl/fl;Tyrosinase-CreERT2 mice (F) or from tamoxifen-exposed BrafV600E/+;Ptenfl/fl;Tyrosinase-CreERT2 mice treated with vehicle (Veh) or AMG44 (G). n=3-7/group (F); n=8/group (G).
(H) Levels of CD80, CD86, or CD40 (MFI ± SEM) in cDC1, cDC2, and MoDCs from Scramble and PERKKO B16 tumors. n=8/group.
(I) Representative histograms of eGFP in intra-tumor-MoDCs, cDC1 or cDC2 from B16-eGFP+ Scramble and B16-eGFP PERKKO-bearing mice. Representative of n=5/group.
Statistics applied using one-way ANOVA (A – C, E, F) or Student’s t-test (D, G, H), *, p<0.05; ***, p < 0.001; ****, p < 0.0001. Please also see Figure S4.
