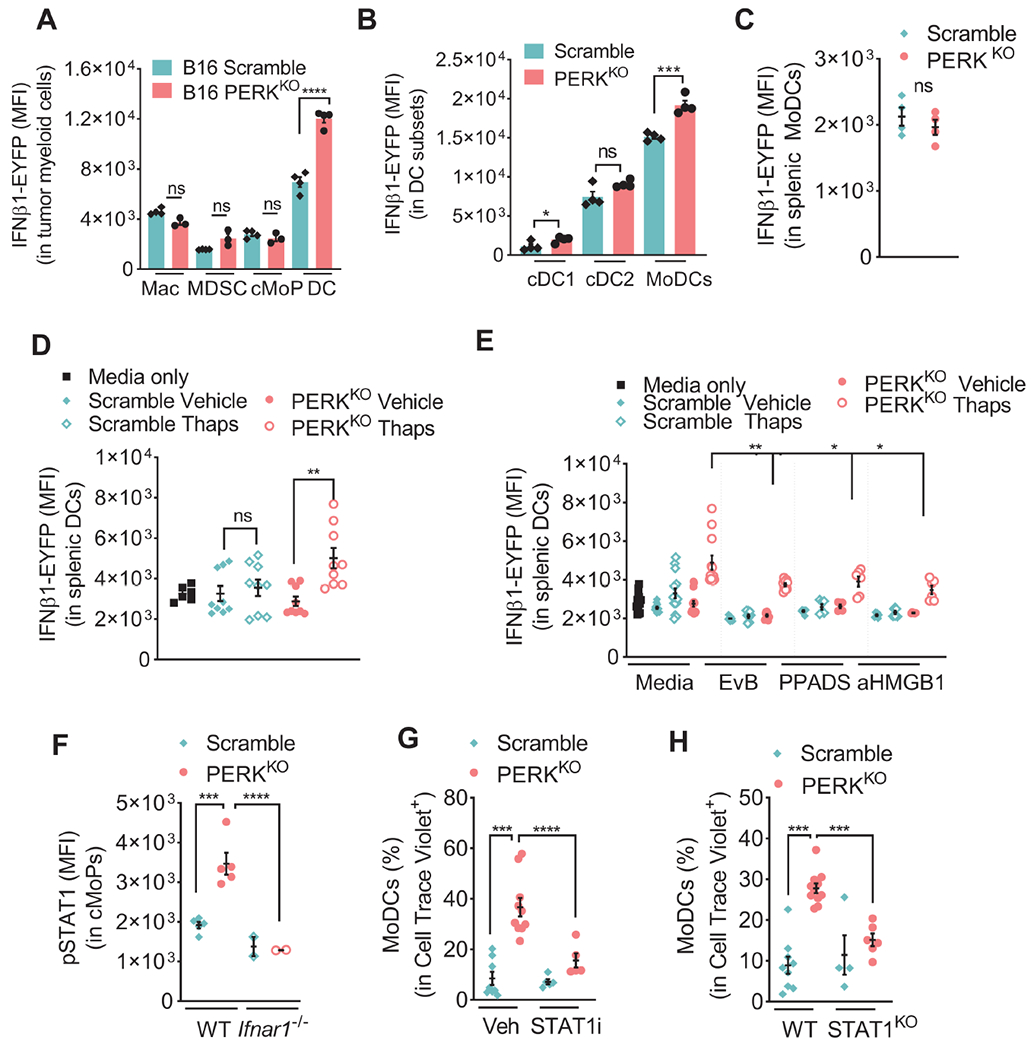
Figure 7: Type I IFN from DCs promotes migration and commitment of cMoPs into MoDCs in PERK-null tumors via STAT1.

(A-B) IFNβ1-EYFP (MFI ± SEM) in Macrophages, MDSCs, cMoPs, and DCs (A), and cDC1, cDC2, or MoDCs (B) from Scramble or PERKKO B16 tumors from mice. n=3-4/group.
(C) IFNβ1-EYFP (MFI ± SEM) in splenic MoDCs from Scramble or PERKKO B16 tumor-bearing mice. n=4/group.
(D) IFNβ1-EYFP in splenic CD11c+ cells (MFI ± SEM) cultured with supernatants from Scramble or PERKKO B16 cells previously treated or not with Thaps, extensively washed, and cultured for 18 hours in regular media. n=6-9/group.
(E) IFNβ1-EYFP MFI ± SEM in splenic CD11c+ cells exposed as in (D) and pretreated with EvB, PPADS or anti-HMGB1. n=6/group.
(F) pSTAT1 (MFI ± SEM) in intra-tumor cMoPs from wildtype (WT) or Ifnar1−/− mice bearing Scramble or PERKKO B16 tumors. n=2-5/group.
(G-H) Cell trace violet (CTV)-labeled splenic cKit+ cells from tumor-free mice were treated with vehicle or fludarabine (STAT1i, 100 μM) (G), or collected from WT or STAT1-null mice (H) and transferred into Scramble or PERKKO B16 tumors. Percentage of MoDCs in CTV+ cells tested in tumors 24 hours later. n=5-10/group (G); n=4-11/group (H).
Statistics were applied using one-way ANOVA (E – H) or a Student’s t-test (A – D), *, p<0.05; **, p<0.01; ***, p < 0.001; ****, p < 0.0001. Please also see Figure S7.
