Abstract
Surface plasmon resonance microscopy (SPRM) is an excellent platform for in situ studying cell-substrate interactions. However, SPRM suffers from poor spatial resolution and small field of view. Herein, we demonstrate plasmonic scattering microscopy (PSM) by adding a dry objective on a popular prism-coupled surface plasmon resonance (SPR) system. PSM not only retains SPRM’s high sensitivity and real-time analysis capability, but also provides ~7 times higher spatial resolution and ~70 times larger field of view than the typical SPRM, thus providing more details about membrane protein response to ligand binding on over 100 cells simultaneously. In addition, PSM allows quantifying the target movements in the axial direction with a high spatial resolution, thus allowing mapping adhesion spring constants for quantitatively describing the mechanical properties of the cell-substrate contacts. This work may offer a powerful and cost-effective strategy for upgrading current SPR products.
Keywords: Surface Plasmon Resonance, Biosensors, Membrane proteins, Cell adhesion, Drug discovery
Graphical Abstract
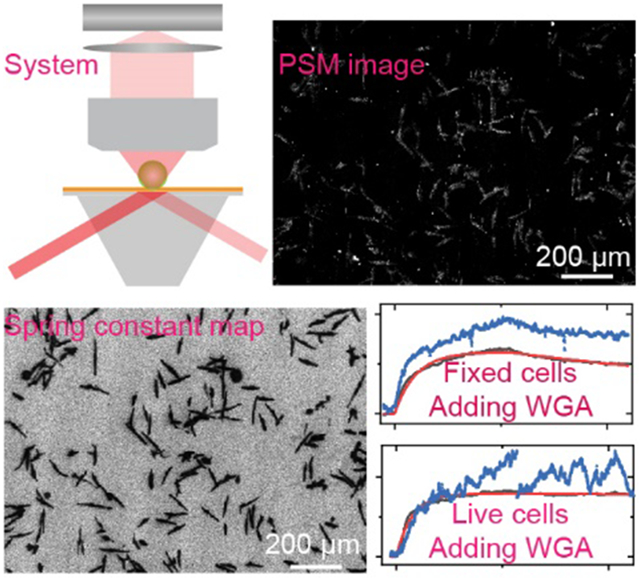
Plasmonic scattering microscopy (PSM) is realized on a prism-coupled surface plasmon resonance (SPR) system. PSM provides ~7 times higher spatial resolution and ~70 times larger field of view than typical SPR microscopy, thus providing more details about cell response to ligand binding on over 100 cells. PSM also allows mapping adhesion spring constants for quantitatively describing mechanical properties of the cell-substrate contacts.
Introduction
Membrane proteins are responsible for many cellular processes such as signaling, communications, and attaching to a surface, as well as recognizing other cells, all essential for living organisms' survival[1]. Membrane proteins are also popular therapeutic targets, accounting for over half of current drug targets[2]. The primary cellular activities and treatment processes usually begin with the binding of ligand or drug molecules to the membrane proteins, and it is thus critical to quantify the binding kinetics of membrane proteins for both understanding the cellular functions and discovering new drugs[3].
Despite the significance, quantifying the binding kinetics of membrane proteins is still challenging. The current mainstream approach isolates the membrane proteins from cell membranes, followed by measuring their binding kinetics with label-free detection systems, such as surface plasmon resonance (SPR), biolayer interferometry, and quartz crystal microbalance[4]. However, the isolating procedures are laborious and may vary the functions of membrane proteins because the native environment is altered[5]. Until now, two approaches have been developed to explore the binding kinetics of membrane proteins in situ, including SPR imaging and membrane deformation tracking methods. SPR imaging permits the highly sensitive analysis of ligand binding events localized within ~100 nm from the sensor surface in real time without the interference of molecules and impurities in the bulk solutions, making it suitable for in situ membrane protein binding kinetic analysis directly in the cells[6]. Recently developed SPR microscopy (SPRM) has further advanced this field by providing spatially resolved information for imaging analysis of single cells[7]. The membrane deformation tracking methods observe the nanometer-scale cellular membrane deformation caused by the molecule binding induced surface tension variations[8]. These approaches permit the membrane protein binding kinetics analysis in native environments, revealing novel features of cell response to ligand binding and offering a solution to validate the ex situ methods. However, these methods still have several limitations. The shared restriction is that SPRM and membrane deformation tracking systems should be constructed with high numerical aperture (NA) objectives, which usually have large magnifications, leading to a small field of view and thus limited imaging throughput. In addition, the SPRM has limited spatial resolution due to the long propagation length of the surface plasmonic wave[9]. To observe the cell-substrate contacts in detail, scanning localized SPRM and Bloch surface wave microscopy was developed for improving the spatial resolution, though with the tradeoff of temporal resolution, making it unsuitable for monitoring the cell dynamics, including molecules binding to membrane proteins[10]. On the other hand, membrane deformation tracking requires a complicated data processing protocol. The cell shape is usually irregular, and the deformation amplitude is usually only several tens of nanometers, so data interpretation is complicated for the adherent cells with highly heterogeneous shapes. The microfluidic trapping of floating cells can solve this issue to some extent, but it needs an extra step to suspend the adherent cells into the solution before the measurement, which destroys the in situ spatial correlation among a population of cells[8b]. In addition, deformation tracking is limited to the cell edges, and averaging the whole-cell signal is generally needed to obtain a sufficient signal-to-noise ratio (SNR). Therefore, it cannot resolve subcellular binding information.
We have recently developed plasmonic scattering microscopy (PSM), a novel SPR imaging approach with a detection limit down to the single-molecule level[11]. Here we show that PSM can be implemented with a large imaging area for in situ membrane protein binding kinetic analysis on a population of cells with high spatial resolution. We constructed a PSM system on a popular prism coupled SPR system using commercially available components, and experimentally demonstrated ~70 times larger field of view and ~7 times higher spatial resolution than SPRM. These improvements enable imaging and analyzing cell response to ligand binding with high spatial resolution on a population of cells. PSM retains SPRM’s advantages of high sensitivity and real-time monitoring capability, making it also suitable for analyzing the kinetics of protein and small molecules binding to membrane proteins. In addition, the PSM also maintains the advantage of SPRM in tracking the object movements in the axial direction with high precision. Thus, combined with the high spatial resolution imaging capability, the PSM can map the cell adhesion spring constant, which has been proposed to physically model the cell adhesion mechanism[12], for quantitative analysis of cell-substrate interactions.
Results and Discussion
Imaging Principles
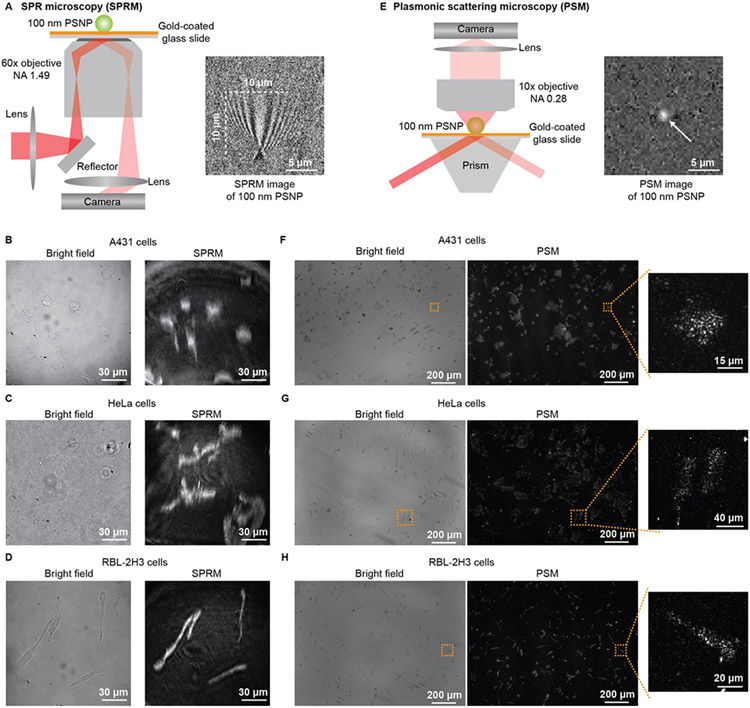
The classical SPRM is usually constructed using a 60x objective with 1.49 NA in one inverted microscopy (Fig. 1A). The SPRM image contrast is determined by the interference between the planar plasmonic wave and the plasmonic wave scattered by the analyte. The long propagation length of the surface plasmonic wave leads to a parabolic tail following the spot at the location of the analyte[9]. The tails from different analytes can interfere with each other, and thus the distance between two analytes should be larger than the propagation length for spatially resolved detection[13], leading to a spatial resolution of ~10 μm with the incident wavelength of 660 nm in this study. Limited by this low spatial resolution, SPRM can hardly provide the subcellular details about the adherent cells, although the cells present higher image contrast in SPRM images than in bright field images (Fig. 1B-D). In addition, using the high magnification objective makes SPRM only have an imaging field of view of about 160 μm in diameter.
Figure 1.
Comparison of SPRM with PSM imaging of fixed cells. (A) Simplified sketch of the optical setup for SPRM, and SPRM image of one 100 nm polystyrene nanoparticle (PSNP). (B, C and D). Bright field and SPRM images of fixed A431, HeLa, and RBL-2H3 cells. (E) Simplified sketch of the optical setup for PSM, and PSM image of one 100 nm PSNP. (F, G and H). Bright field and PSM images of fixed A431, HeLa, and RBL-2H3 cells.
To improve the SPR imaging spatial resolution, the PSM method is developed[11], where one objective observes the plasmonic wave scattered by analytes on the top of the gold-coated glass slide (Fig. 1E). In PSM, the surface plasmonic waves only play the role of illumination, and thus the analyte is shown as an Airy spot in the image. Considering the imaging objective has an NA of 0.28, The spatial resolution can be estimated to be ~1.4 μm based on the Rayleigh criterion for PSM, which is ~7 times higher than SPRM with the same incident wavelength of 660 nm. Besides, the PSM can achieve this spatial resolution with a prism coupled excitation of surface plasmonic wave and a low magnification objective to observe the analyte scattering over a large viewing area (Fig. S1). In this study, limited by the camera imaging area, the field of view is determined to be ~1.4 mm ×1.0 mm, which is ~70 times larger than classical SPRM. Owing to high spatial resolution and a large field of view, the PSM can simultaneously observe the subcellular details in over 100 cells with different shapes (Fig. 1F-H). In contrast to the classical SPRM images, where the cells look like they are spreading over the surface, the PSM images clearly show that the cells attach to the surface via some adhesion sites, which can be more clearly seen from the simultaneous SPRM and PSM imaging (Fig. S2). To further explore the source of PSM signals, the cellular membrane was stained with DiI, and then the total internal reflection fluorescence (TIRF) images were recorded to compare with the PSM images on a gold-coated glass slide and evanescent scattering images on the cover glass, where the cover glass was employed to avoid the quenching effect from the gold film (Fig. S3 and S4). The TIRF images show similar morphologies as PSM images, which indicate that PSM signals mainly come from the membrane-substrate contacts. The high refractive index cellular vesicles or similar organelles nearby the cellular membrane may also contribute to the PSM signals[14]. The PSM images of cells may look a little different from other kinds of high spatial resolution SPRM[10a-e], interference reflection microscopy[15], and electrochemiluminescence microscopy[16], which should be because the adhesion schemes differ with cell lines and surface modifications[17]. Overall, the experimental results still show that the PSM can provide more detailed information than classical SPRM about the cell-substrate contacts.
The PSM does not employ any scanning schemes, thus maintaining the real-time imaging capability of classical SPRM. Measurement SNR is important for evaluating the system sensitivity, and is usually linearly related to the imaging objective NA[11b]. The objective for the large view PSM has ~5 times smaller NA than classical SPRM, where the oil immersion objective with 1.49 NA was employed. However, the PSM does not collect the strong reflection, thus allowing high incident intensity[11a]. Here the PSM employs the incident intensity of ~3 W/cm2, which is ~30 times higher than classical SPRM[18], and ~5 times SNR enhancement based on the shot noise estimation[19]. As a result, the PSM can provide similar SNR to the classical SPRM even with a low NA objective. As a proof of concept, the 100 nm nanoparticles are measured by PSM, and the SNR is determined to be ~60 (Fig. S5), which is close to the SPRM measurement results[20]. These results indicate that the PSM maintains the high sensitivity and real-time monitoring capability of SPRM, making it possible to analyze the binding kinetics with an improved field of view and spatial resolution.
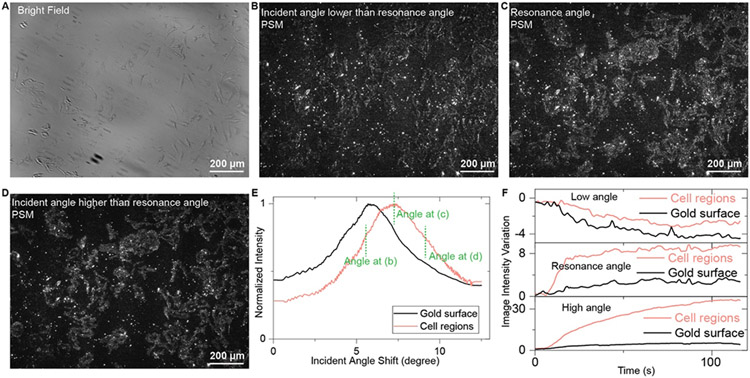
Two components during the molecule binding process determine the PSM sensor output. The first component is the additional plasmonic wave scattered by the binding molecules, which obviously has a positive image contrast[11a]. The second component is the scattering intensity variation caused by the changing local surface plasmonic waves because the molecular binding can change the resonance conditions of SPR[21]. According to the multiple reflectance theory, this component may have a negative image contrast at an incident angle lower than the resonance angle, zero image contrast at the resonance angle, or positive image contrast at an incident angle higher than the resonance angle (Fig. S6). To find the best working incident angle, the binding of wheat-germ agglutinin (WGA; Molecular weight, 35 kDa) to N-acetylglucosamine (GlcNAc) in fixed HeLa cells is measured by PSM at different incident angles (Fig. 2). The bright field image and PSM images at different incident angles are shown in Fig. 2A-D, showing that the surface roughness of bare gold has smaller background scattering at a high incident angle due to the different resonance conditions between bare gold and cell adhesion regions (Fig. 2E). In addition, the real-time monitoring shows that the PSM image intensity variation is negative at the low angle, and positive at the high angle (Fig. 2F). The PSM image intensity response is not zero but positive at the resonance angle due to the additional plasmonic wave scattered by the binding molecules. Thus, the PSM should have a better measurement sensitivity at a high incident angle, where the sensor responses are positive from both components, while the background from scattering by surface roughness is small. The incident angle used in Fig. 2D is fixed for the following experiments.
Figure 2.
PSM imaging of fixed HeLa cells at different incident angles. (A) Bright field image of fixed HeLa cells. (B-D) PSM image of fixed HeLa cell at the incident angle lower than resonance angle (B), the resonance angle (C), and the incident angle higher than resonance angle (D). (E) Normalized PSM image intensity variation against the incident angle in cell adhesion area and bare gold surface. The incident angles used for (B-D) were marked in the figure. (F) PSM image intensity variations during the process of changing PBS buffer to 25 μg/mL WGA solution at a high angle, during the process of changing 25 μg/mL to 50 μg/mL WGA solution at a resonance angle, and during the process of changing 50 μg/mL to 100 μg/mL WGA solution at a low angle.
Membrane protein binding kinetics in fixed cells
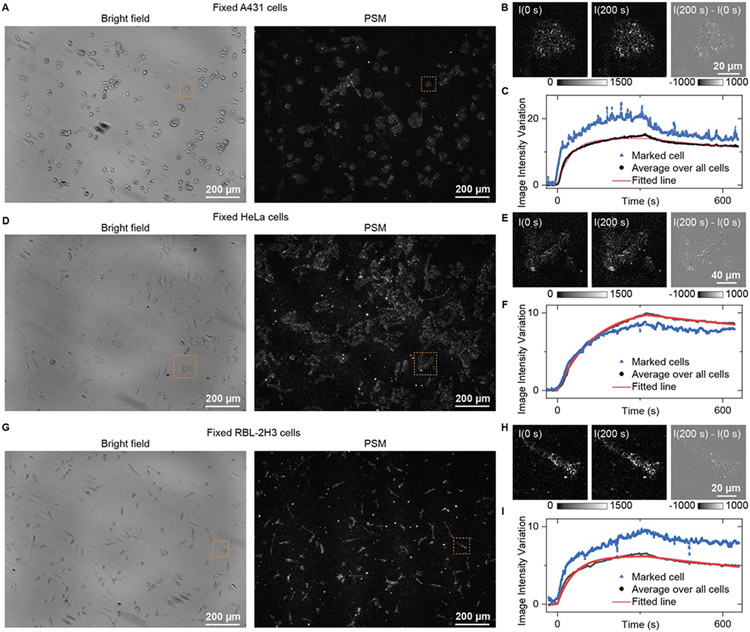
Figure 3 shows the kinetics analysis of WGA binding to GlcNAc in fixed A431, HeLa, and RBL-2H3 cells, where the fixation is employed to minimize the cell micromotions, since cell micromotions introduce a background noise[8]. The bright field and PSM images of fixed A431, HeLa and RBL-2H3 cells are shown in Fig. 3A, 3D, and 3G, respectively. First, PBS buffer was injected into the channel to flow over the cells with a flow rate of 200 μL/min for 30 s to obtain a baseline. Then, 25 μg/mL WGA in PBS buffer was introduced for 350 s to allow the association of WGA with the GlcNAc on the cells. Finally, the flow was switched back to PBS buffer for another 300 s to allow the WGA dissociation from the cells. The cells within the field of view show increasing image intensity during the WGA binding process (A431 as an example in Movie S1). The dynamic process and differential image show that the cell response to WGA binding is also basically positive at the single adhesion site level (Fig. 3B, 3E, and 3H; Movie S2-4). Plotting the image intensity of the cells within the marked regions in Fig. 3A, 3D and 3G, the binding curves can be achieved as shown in Fig. 3C, 3F and 3I. Some fluctuations in these curves still exist, which may be due to the cellular Brownian motions[22]. Averaging the image intensity over all the cells within the field of view can achieve much smoother binding curves than the single cell traces. By fitting the binding curves with a first-order binding kinetics model, the association rate constant (kon), dissociation rate constant (koff), and dissociation constant (KD) were found to be (2.6 ± 0.01) × 104 M−1s−1, (7.0 ± 0.03) × 10−4 s−1, and 27 ± 0.1 nM for fixed A431 cells, (9.5 ± 0.03) × 103 M−1s−1, (4.2 ± 0.01) × 10−4 s−1, and 44 ± 0.1 nM for fixed HeLa cells, and (2.3 ± 0.01) × 104 M−1s−1, (7.1 ± 0.04) × 10−4 s−1, and 31 ± 0.2 nM for fixed RBL-2H3 cells, respectively. The binding kinetics slightly differ among the cell lines, which can also be seen from the measurement of cell response to WGA solution with different concentrations (Fig. S7)[23]. This may be because the GlcNAc conditions and contents differ with cell lines.
Figure 3.
PSM measurement of WGA binding to membrane in fixed cells. (A, D, and G) Bright field and PSM image of fixed A431 (A), HeLa (D), and RBL-2H3 (G) cells. (B, E, and H) Zoomed views of marked region in (A, D, and G) at 0 s and 200 s after changing the flow to 25 μg/mL WGA solution, and the differential image. (C, F, and I) The image intensity variation against time from the cells in the marked zone and by averaging the signal of all cells within the field of view shown in (A, D, and G). The fitted line is achieved by fitting the curve with a first-order binding kinetics model.
Membrane protein binding kinetics in live cells
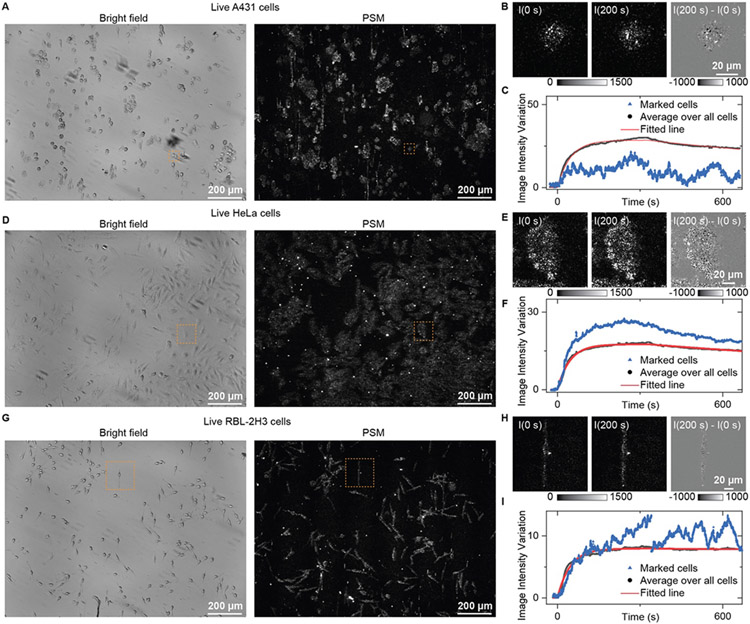
The fixation processing may change the membrane protein conditions, leading to different binding kinetics from the living conditions. Thus, determining the membrane protein binding kinetics in live cells is desirable in biochemical applications. However, the large micromotions of live cells due to metabolic activities usually result in large background noise, making it challenging to conduct binding kinetics analysis in live cells with high SNR. Given that the micromotions are random under normal conditions, the signal fluctuations caused by them may be reduced by averaging multiple cells. The bright field and PSM images of live A431, HeLa, and RBL-2H3 cells are shown in Fig. 4A, 4D, and 4G, respectively. First, a live cell imaging solution was injected into the channel to flow over the cells with a flow rate of 200 μL/min for 30 s to obtain a baseline. Then, 25 μg/mL WGA in live cell imaging solution was introduced for 350 s to allow the association of WGA with the GlcNAc on the cells. Finally, the flow was switched back to the live cell imaging solution for another 300 s to allow the WGA dissociation from the cells. During the binding process, the cells within the field of view show increasing image intensity, which is more prominent than fixed cells (A431 as an example in Movie S1). However, the live cells have large micromotions, which can be seen from the dynamic processes and differential images of the single cells (Fig. 4B, 4E, and 4H; Movie S2-4). As a result, large fluctuations can be found in the binding curves of single cells for some cell lines, such as A431 and RBL-2H3 (Fig. 4C and 4I), making fitting hard. Fortunately, averaging the image intensity over all the cells within the field of view can alleviate the cell micromotion effects for a smooth binding curve. By fitting the binding curves with a first-order binding kinetics model, the kon, koff, and KD were found to be (3.1 ± 0.02) × 104 M−1s−1, (6.6 ± 0.04) × 10−4 s−1, and 21 ± 0.1 nM for live A431 cells, (3.3 ± 0.01) × 103 M−1s−1, (4.5 ± 0.03) × 10−4 s−1, and 13.6 ± 0.05 nM for live HeLa cells, and (4.1 ± 0.03) × 104 M−1s−1, (4.7 ± 0.3)× 10−5 s−1, and 1.1 ± 0.01 nM for live RBL-2H3 cells, respectively. Table 1 shows that the binding kinetics differ between the fixed and live cells, which may be because the fixation process altered the membrane protein conditions, leading to different binding kinetics.
Figure 4.
PSM measurement of WGA binding to membrane in live cells. (A, D, and G) Bright field and PSM image of live A431 (A), HeLa (D), and RBL-2H3 (G) cells. (B, E, and H) Zoomed views of marked region in (A, D, and G) at 0 s and 200 s after changing the flow to 25 μg/mL WGA solution, and the differential image. (C, F, and I) The image intensity variation against time from the cells in the marked zone and by averaging the signal of all cells within the field of view shown in (A, D, and G). The fitted line is achieved by fitting the curve with a first-order binding kinetics model.
Table 1.
Association rate constants (kon), dissociation rate constants (koff), and equilibrium constants (KD) for WGA binding to GlcNAc in the fixed and live cells.
| WGA binding to | kon (M−1s−1) | koff (s−1) | KD (nM) |
|---|---|---|---|
| Fixed A431 | (2.6 ± 0.01) × 104 | (7.0 ± 0.03) × 10−4 | 27 ± 0.1 |
| Live A431 | (3.1 ± 0.02) × 104 | (6.6 ± 0.04) × 10−4 | 21 ± 0.1 |
| Fixed HeLa | (9.5 ± 0.03) × 103 | (4.2 ± 0.01) × 10−4 | 44 ± 0.1 |
| Live HeLa | (3.3 ± 0.01) × 103 | (4.5 ± 0.03) × 10−4 | 13.6 ± 0.05 |
| Fixed RBL-2H3 | (2.3 ± 0.01) × 104 | (7.1 ± 0.04) × 10−4 | 31 ± 0.2 |
| Live RBL-2H3 | (4.1 ± 0.03) × 104 | (4.7 ± 0.3) × 10−5 | 1.1 ± 0.01 |
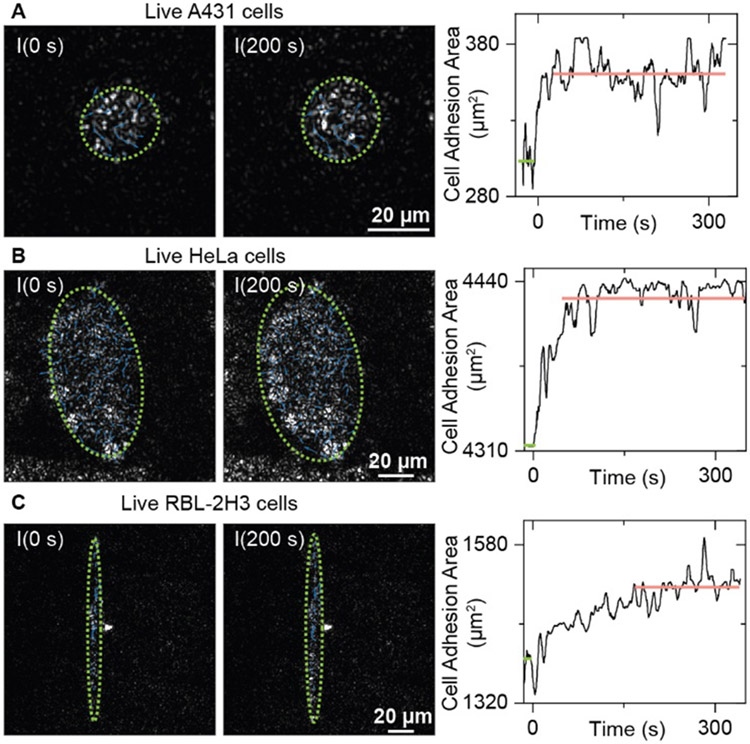
The live cells also show more complicated behaviors than fixed cells in the WGA binding processes. In addition to the random micromotions, the live cells also present an increase in adhesion areas and the creation of new adhesion sites (Movie S2-4), which may lead to the intensity variations in living cells being more prominent than in fixed cells (Fig. 3 and 4). To estimate the variation of adhesion areas, we approximate the shape of the adhesion area as an ellipse, where the lengths of major and minor axes are estimated by calculating the distance between the adhesion sites in two orthogonal directions. Real time tracking shows that the cell adhesion area increase during the WGA binding processes (Fig. 5), agreeing with the measurement results of membrane deformation tracking methods, which show that the cells will expand after the molecular ligand binding[8]. These results indicate that the PSM can resolve the membrane deformation with a high spatial resolution, which is difficult for classical SPRM. Furthermore, considering that the cell expansion may push more membrane contents into the surface plasmon field, resulting in a larger scattering intensity, it is possible to employ the PSM image intensity to quantify the cell deformation caused by small molecular binding.
Figure 5.
Cell adhesion area variation during the WGA binding process. PSM images of single live A431 cells (A), HeLa cells (B), and RBL-2H3 cells (C) at 0 s and 200 s after changing the flow to 25 μg/mL WGA solution. The green dashed ellipse indicates the ellipse for estimating the cell adhesion area. The cell adhesion area variations against the time are also presented. The green line indicates the mean cell adhesion area before WGA binding, and the pink line indicates the mean cell adhesion area after WGA binding. The dynamic processes can be found in Movies S2-4.
Antibody and small molecule binding to membrane proteins
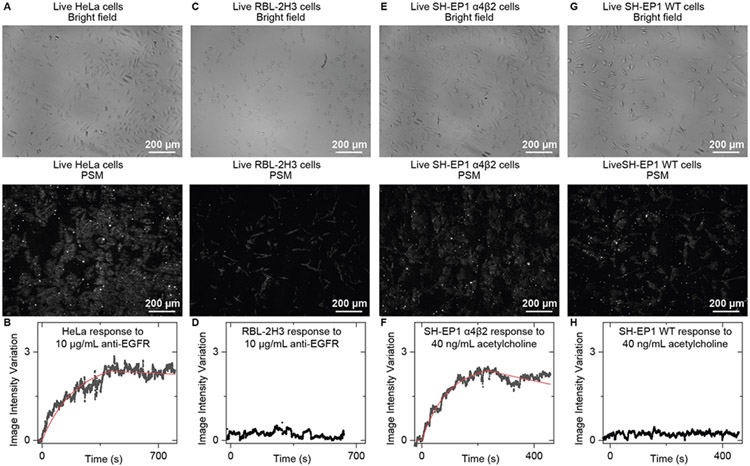
We first demonstrated the PSM capability for specific binding kinetics analysis by measuring the antibody binding to epidermal growth factor receptor (EGFR). The bright field and PSM images of live HeLa cells are shown in Fig. 6A. Following a similar procedure to that described above for the WGA binding, we can achieve a smooth binding curve after averaging the image intensity over all the cells within the field of view (Fig. 6B). By fitting the binding curves with a first-order binding kinetics model, the kon, koff, and KD were found to be 7.4 × 10⁴ M−1s−1, 1.2 × 10⁻⁴ s−1, and 1.6 nM, respectively. These results agree with the measurement by membrane deformation tracking approaches[8b]. The response of RBL-2H3 cells from rats to the anti-human EGFR is employed as a negative control. The bright field and PSM images of live RBL-2H3 cells are shown in Fig. 6C. Averaging the image intensity over all the cells within the field of view shows that the RBL-2H3 cells have no response to the anti-human EGFR (Fig. 6D), demonstrating that the PSM allows the specific binding kinetics analysis.
Figure 6.
PSM measurement of antibody and small molecule binding kinetics on live cells. (A) Bright field and PSM images of live HeLa cells. (B), The image intensity variation against time by averaging the signals of all cells within the field of view shown in (A) during the anti-EGFR binding process. The fitted line is achieved by fitting the curve with a first-order binding kinetics model. (C) Bright field and PSM images of live RBL-2H3 Cells. (D), The image intensity variation against time by averaging the signal of all cells within the field of view shown in (C) during exposure to anti-EGFR as the negative control. (E) Bright field and PSM images of live SH-EP1 α4β2 Cells. (F), The image intensity variation against time by averaging the signals of all cells within the field of view shown in (E) during the acetylcholine binding process. The fitted line is achieved by fitting the curve with a first-order binding kinetics model. (G) Bright field and PSM images of live SH-EP1 WT Cells. (H), The image intensity variation against time by averaging the signal of all cells within the field of view shown in (G) during exposure to acetylcholine as the negative control.
To demonstrate the small molecule binding detection capability of PSM, we studied the binding of acetylcholine (182 Da) to nicotinic acetylcholine receptors (nAChRs) using engineered SH-EP1 cells expressing human α4β2 receptors. nAChRs play a critical role in neurotransmission and nicotine addiction[24]. The bright field and PSM images of SH-EP1 α4β2 cells are shown in Fig. 6E. Following a similar procedure to that described above for the WGA binding, we can achieve a smooth binding curve after averaging the image intensity over all the cells within the field of view (Fig. 6F). By fitting the binding curves with a first-order binding kinetics model, the kon, koff, and KD were found to be 4.9 × 10⁴ M−1s−1, 9.9 × 10⁻⁴ s−1, and 20 nM, respectively. The KD value falls within the range from 16 to 69 nM achieved by membrane deformation approaches[8]. The response of wild type (WT) SH-EP1 cells to acetylcholine is employed as a negative control. The bright field and PSM images of live SH-EP1 WT cells are shown in Fig. 6G. Averaging the image intensity over all the cells within the field of view shows that the SH-EP1 WT cells have no response to the acetylcholine (Fig. 6D), demonstrating that the PSM allows the small molecule binding kinetics analysis.
Mapping of cell adhesion spring constants
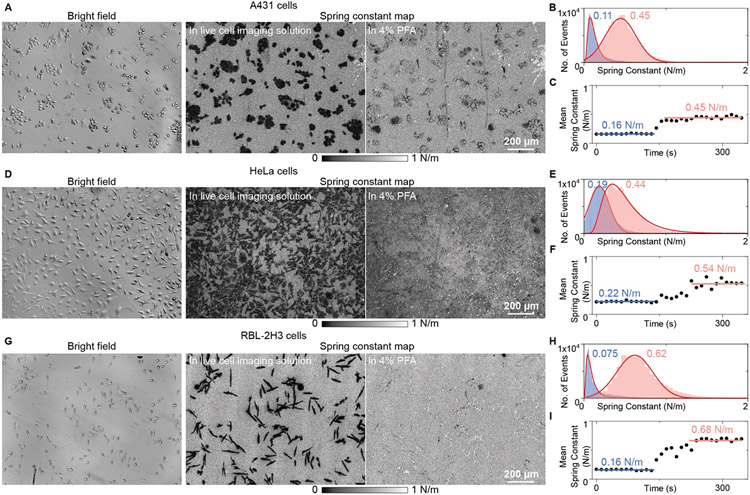
The spring model has been theoretically proposed to quantify the mechanical stability of molecule junctions, and experimentally demonstrated by recent single-molecule imaging studies, where the spring constant was employed as the sensor output[22a, 25]. Cell-substrate contacts can be considered as a batch of molecular junctions, and thus the spring model was predicted to be suitable for quantitatively describing the cell adhesion mechanism a decade ago[12]. Recently it has been demonstrated that the SPRM can quantify the spring constants of bacteria-substrate contacts for antimicrobial interface screening by statistically analyzing the object motions in the axial direction, which can be achieved by tracking the SPR intensity fluctuations [26]. However, it is still challenging to use traditional SPR systems such as SPRM to study the eukaryotic cell-substrate contacts because the SPR signals from densely distributed adhesion sites could interfere with each other. The PSM system can provide high spatial resolution images without the interference from delocalized plasmonic waves, thus allowing the statistical analysis at each pixel to map the cell adhesion spring constants for quantitative description of the cell adhesion properties. For experimental demonstration, the typical cell fixing process with 4% paraformaldehyde (PFA) was studied with PSM imaging. We firstly flowed the live cell imaging solution over cells for about 2 minutes, and then switched the solution to the 4% PFA in PBS buffer for fixing the cells. The bright field and PSM images of cells in living and fixed conditions look similar (Fig. S8), but the cell thermal motions are different (Fig. S9). After tracking and analyzing the object motion amplitudes in the axial direction with thermodynamic approaches [11d, 22a, 25c], the spring constant at each spot can be achieved. Fig. 7A, 7D, and 7G show the bright field images and spring constant maps of A431, HeLa, and RBL-2H3 cells, which clearly show that the spring constants are larger in living than fixed conditions. This is expected because the spring constant reflects the restoring force of molecular adhesion bonds, and the restoring force should be lower in living conditions, where the cells are far away from the thermal equilibrium state and their conditions are easier to change. The dynamic process can show the cell adhesion spring constant variations during the fixing process more clearly (Movie S5). Fig. 7B, 7E, and 7H show the single-pixel spring constant distribution in one map in living and fixed conditions, respectively. After fitting, we can achieve the mean spring constant of each image. Plotting of the mean spring constant over time in Fig. 7C, 7F, and 7I shows that the cell adhesion spring constant variations differ with cell lines, which should be because the adhesion mechanics differ with cell lines and surface modifications [10b].
Figure 7.
PSM mapping of cell adhesion spring constants. (A), (D), and (G), Bright field images and spring constant maps of A431 (A), HeLa (D), and RBL-2H3 (G) cells. (B), (E), and (H), Single-pixel spring constant distribution in one map for A431 (B), HeLa (E), and RBL-2H3 (H) cells in living and fixed conditions. The distributions are fitted using Gaussian or Lognormal functions. (C), (F), and (I), Plotting of the mean spring constant over time for A431 (C), HeLa (F), and RBL-2H3 (I) cells during the fixing process. The dynamic processes can be found in Movies S5.
Conclusion
Determining the kinetics of molecule binding to membrane proteins is critical for studying the cell functions and new drugs, which has motivated many efforts to develop label-free detection approaches for real-time binding kinetics analysis. SPR is the mainstream technology for binding kinetics analysis owing to its high surface sensitivity, and SPRM has advanced this field by providing the binding kinetics analysis in single cells[7c]. However, SPRM has poor spatial resolution due to the delocalized surface plasmonic waves. The cell adhesion sites are close to each other, and the surface plasmonic waves scattered by them can interfere with each other, leading to a complicated pattern. This pattern can misguide the users to achieve a wrong thought that the cells adhere to the sensor surface in a flat-lying geometry.
PSM improves the SPR imaging spatial resolution to a diffraction-limited level, thus avoiding this misunderstanding and allowing the detailed observation of cellular membrane response to molecule binding. In addition, PSM can provide a large field of view while maintaining the real-time monitoring capability and high SNR of SPRM. Thus, the signal fluctuations from large micromotions can be averaged out by considering the signals from multiple cells, making it possible to analyze the kinetics of proteins and small molecules binding to the membrane proteins in live cells by simply tracking the image intensity variations.
PSM not only improves the spatial resolution of SPR imaging, but also retains the real-time monitoring capability and high measurement sensitivity. This makes it possible to map the cell adhesion spring constants, providing one approach to experimentally demonstrate the cell adhesion spring models for quantifying the cell adhesion mechanical properties. In addition, the PSM shows that the far-field scattering of evanescent waves, one kind of signal usually neglected by traditional sensors, can be employed to provide better measurement performance than reflection light monitoring channels. This may pave a road to using the low-cost detection schemes, which are usually considered to have insufficient sensitivity, for in situ analysis of cell-substrate contacts and membrane protein binding kinetics. For example, the total internal reflection scheme with conventional cover glasses can also be used in the PSM system for analyzing the cell properties (Fig. S10).
In this paper, we demonstrated that the PSM could achieve 70 times larger field of view, 7 times higher spatial resolution, and similar SNR compared with classical SPRM, and the setup is constructed with commercially available components. The PSM spatial resolution is limited by diffraction rather than the surface plasmon propagation properties, and thus it can be improved by employing a high NA objective[11b, 11d]. The field of view of PSM is limited by the illumination area, the field of view of the objective, and the camera sensor size. Thus it may be improved by employing customer-built large prisms and a flat–curved–flat imaging strategy[27]. In addition, the PSM does not collect the strong reflection, thus allowing the incident intensity up to 3 kW/cm2, which is ~1000 times higher than the incident intensity used here[11a]. These indicate that there are still rooms for the users to improve the PSM performance based on the specific application, such as high throughput imaging, spatially resolved monitoring, and high SNR detection of small molecule binding. In addition, the PSM can be constructed by upgrading a common SPR imaging system, which has been widely used in laboratories and commercial products. Also, the 10x dry objective (~100 to 1k USD) used here is much cheaper than SPRM’s oil immersion objective (~ 10k USD). Thus, this approach may pave an easy-to-build and economical road for developing the SPR, a traditional and widely used technology, into the next generation to better serve the biochemical community and pharmaceutical industry.
Supplementary Material
Acknowledgements
Authors declare that they have no competing interests. We are grateful for financial support from the National Institute of General Medical Sciences of the National Institutes of Health grant R01GM107165. We acknowledge the use of facilities within the ASU NanoFab supported in part by NSF program NNCI-ECCS-1542160.
References
- [1].a) DiNitto Jonathan P, Cronin Thomas C, Lambright David G, Sci. STKE 2003, 2003, re16; [DOI] [PubMed] [Google Scholar]; b) Cho W, Stahelin RV, Annu. Rev. Biophys. Biomol. Struct 2005, 34, 119–151. [DOI] [PubMed] [Google Scholar]
- [2].Hopkins AL, Groom CR, Nat. Rev. Drug Discov 2002, 1, 727–730. [DOI] [PubMed] [Google Scholar]
- [3].a) Copeland RA, Pompliano DL, Meek TD, Nat. Rev. Drug Discov 2006, 5, 730–739; [DOI] [PubMed] [Google Scholar]; b) Swinney DC, Curr. Opin. Drug Discov. Dev 2009, 12, 31–39. [PubMed] [Google Scholar]
- [4].a) Bieri C, Ernst OP, Heyse S, Hofmann KP, Vogel H, Nat. Biotechnol 1999, 17, 1105–1108; [DOI] [PubMed] [Google Scholar]; b) Perillat D, Tan H, Zuk R, Lockard S, Phi-Wilson J, Howes M, Gamez J, Ellis T, Ho H, Du K, Recknor M, Carricato G, Concepcion J, Zhao L-S, Varma R, Ma W, Heidecker B, Li P, Wei J, Persson H, Yao D, Choo S, Wartchow C, Witte K, Comb. Chem. High Throughput Screen 2009, 12, 791–800; [DOI] [PubMed] [Google Scholar]; c) Nirschl M, Reuter F, Vörös J, Biosensors 2011, 1, 70–92; [DOI] [PMC free article] [PubMed] [Google Scholar]; d) Navratilova I, Besnard J, Hopkins AL, ACS Med. Chem. Lett 2011, 2, 549–554; [DOI] [PMC free article] [PubMed] [Google Scholar]; e) Pei Z, Saint-Guirons J, Käck C, Ingemarsson B, Aastrup T, Biosens. Bioelectron 2012, 35, 200–205; [DOI] [PubMed] [Google Scholar]; f) Subramanian K, Fee CJ, Fredericks R, Stubbs RS, Hayes MT, J. Mol. Recognit 2013, 26, 643–652. [DOI] [PubMed] [Google Scholar]
- [5].Baksh MM, Kussrow AK, Mileni M, Finn MG, Bornhop DJ, Nat. Biotechnol 2011, 29, 357–360. [DOI] [PMC free article] [PubMed] [Google Scholar]
- [6].Zhang F, Wang S, Yin L, Yang Y, Guan Y, Wang W, Xu H, Tao N, Anal. Chem 2015, 87, 9960–9965. [DOI] [PMC free article] [PubMed] [Google Scholar]
- [7].a) Wang W, Foley K, Shan X, Wang S, Eaton S, Nagaraj VJ, Wiktor P, Patel U, Tao N, Nat. Chem 2011, 3, 249–255; [DOI] [PMC free article] [PubMed] [Google Scholar]; b) Zhou X-L, Yang Y, S. Wang, Liu X-W, Angew. Chem. Int. Ed 2020, 59, 1776–1785; [DOI] [PMC free article] [PubMed] [Google Scholar]; c) Wang W, Yang Y, Wang S, Nagaraj VJ, Liu Q, Wu J, Tao N, Nat. Chem 2012, 4, 846–853. [DOI] [PMC free article] [PubMed] [Google Scholar]
- [8].a) Guan Y, Shan X, Zhang F, Wang S, Chen H-Y, Tao N, Sci. Adv 2015, 1, e1500633; [DOI] [PMC free article] [PubMed] [Google Scholar]; b) Zhang F, Jing W, Hunt A, Yu H, Yang Y, Wang S, Chen H-Y, Tao N, ACS Nano 2018, 12, 2056–2064. [DOI] [PMC free article] [PubMed] [Google Scholar]
- [9].Yu H, Shan X, Wang S, Chen H, Tao N, Anal. Chem 2014, 86, 8992–8997. [DOI] [PubMed] [Google Scholar]
- [10].a) Peterson AW, Halter M, Tona A, Plant AL, BMC Cell Biol. 2014, 15, 35; [DOI] [PMC free article] [PubMed] [Google Scholar]; b) Toma K, Kano H, Offenhäusser A, ACS Nano 2014, 8, 12612–12619; [DOI] [PubMed] [Google Scholar]; c) Peterson AW, Halter M, Plant AL, Elliott JT, Rev. Sci. Instrum 2016, 87, 093703; [DOI] [PMC free article] [PubMed] [Google Scholar]; d) Kreysing E, Hassani H, Hampe N, Offenhäusser A, ACS Nano 2018, 12, 8934–8942; [DOI] [PubMed] [Google Scholar]; e) Peterson AW, Halter M, Tona A, Plant AL, Elliott JT, Proceedings of SPIE--the International Society for Optical Engineering 2018, 10509, 1050905; [DOI] [PMC free article] [PubMed] [Google Scholar]; f) Kuai Y, Chen J, Tang X, Xiang Y, Lu F, Kuang C, Xu L, Shen W, Cheng J, Gui H, Zou G, Wang P, Ming H, Liu J, Liu X, Lakowicz JR, Zhang D, Sci. Adv 2019, 5, eaav5335. [DOI] [PMC free article] [PubMed] [Google Scholar]
- [11].a) Zhang P, Ma G, Dong W, Wan Z, Wang S, Tao N, Nat. Methods 2020, 17, 1010–1017; [DOI] [PMC free article] [PubMed] [Google Scholar]; b) Zhang P, Ma G, Wan Z, Wang S, ACS Sens. 2021, 6, 1357–1366; [DOI] [PMC free article] [PubMed] [Google Scholar]; c) Zhang P, Wang S, Biocell 2021, 45, 1449–1451; [DOI] [PMC free article] [PubMed] [Google Scholar]; d) Zhang P, Zhou X, Wang R, Jiang J, Wan Z, Wang S, ACS Sens. 2021, 6, 4244–4254. [DOI] [PMC free article] [PubMed] [Google Scholar]
- [12].a) Delanoë-Ayari H, Brevier J, Riveline D, Soft Matter 2011, 7, 824–829; [Google Scholar]; b) Shao D, Levine H, Rappel W-J, Proc. Natl. Acad. Sci. U.S.A 2012, 109, 6851–6856. [DOI] [PMC free article] [PubMed] [Google Scholar]
- [13].Yu H, Shan X, Wang S, Tao N, Anal. Chem 2017, 89, 2704–2707. [DOI] [PubMed] [Google Scholar]
- [14].a) Yang Y, Yu H, Shan X, Wang W, Liu X, Wang S, Tao N, Small 2015, 11, 2878–2884; [DOI] [PMC free article] [PubMed] [Google Scholar]; b) Park J-S, Lee I-B, Moon H-M, Joo J-H, Kim K-H, Hong S-C, Cho M, Chem. Sci 2018, 9, 2690–2697. [DOI] [PMC free article] [PubMed] [Google Scholar]
- [15].a) Barr VA, Bunnell SC, Curr. Protoc. Cell Biol 2009, 45, 4.23.1–4.23.19; [DOI] [PMC free article] [PubMed] [Google Scholar]; b) Limozin L, Sengupta K, Chemphyschem 2009, 10, 2752–2768. [DOI] [PubMed] [Google Scholar]
- [16].a) Ding H, Guo W, Su B, Angew. Chem. Int. Ed 2020, 59, 449–456; [DOI] [PubMed] [Google Scholar]; b) Ding H, Zhou P, Fu W, Ding L, Guo W, Su B, Angew. Chem. Int. Ed 2021, 60, 11769–11773. [DOI] [PubMed] [Google Scholar]
- [17].a) Axelrod D, Traffic 2001, 2, 764–774; [DOI] [PubMed] [Google Scholar]; b) Mattheyses AL, Simon SM, Rappoport JZ, Cell Sci J. 2010, 123, 3621–3628. [DOI] [PMC free article] [PubMed] [Google Scholar]
- [18].Shan X, Díez-Pérez I, Wang L, Wiktor P, Gu Y, Zhang L, Wang W, Lu J, Wang S, Gong Q, Li J, Tao N, Nat. Nanotechnol 2012, 7, 668–672. [DOI] [PubMed] [Google Scholar]
- [19].Cole D, Young G, Weigel A, Sebesta A, Kukura P, ACS Photonics 2017, 4, 211–216. [DOI] [PMC free article] [PubMed] [Google Scholar]
- [20].a) Wang S, Shan X, Patel U, Huang X, Lu J, Li J, Tao N, Proc. Natl. Acad. Sci. U.S.A 2010, 107, 16028–16032; [DOI] [PMC free article] [PubMed] [Google Scholar]; b) Yang Y, Shen G, Wang H, Li H, Zhang T, Tao N, Ding X, Yu H, Proc. Natl. Acad. Sci. U.S.A 2018, 115, 10275–10280. [DOI] [PMC free article] [PubMed] [Google Scholar]
- [21].Zhang P, Liu L, He Y, Chen X, Ma K, Wei D, Wang H, Shao Q, Sens. Actuators B Chem 2018, 272, 69–78. [Google Scholar]
- [22].a) Wang H, Tang Z, Wang Y, Ma G, Tao N, J. Am. Chem. Soc 2019, 141, 16071–16078; [DOI] [PubMed] [Google Scholar]; b) Wang Y, Tang Z, Chen H-Y, Wang W, Tao N, Wang H, Proc. Natl. Acad. Sci. U.S.A 2021, 118, e2104598118. [DOI] [PMC free article] [PubMed] [Google Scholar]
- [23].Karlsson R, Katsamba PS, Nordin H, Pol E, Myszka DG, Anal. Biochem 2006, 349, 136–147. [DOI] [PubMed] [Google Scholar]
- [24].Wu J, Kuo Y-P, George AA, Xu L, Hu J, Lukas RJ, J. Biol. Chem 2004, 279, 37842–37851. [DOI] [PubMed] [Google Scholar]
- [25].a) Lee J, Hernandez P, Lee J, Govorov AO, Kotov NA, Nat. Mater 2007, 6, 291–295; [DOI] [PubMed] [Google Scholar]; b) Wang H, Wang Z, Wang Y, Hihath J, Chen H-Y, Li Y, Tao N, J. Am. Chem. Soc 2018, 140, 18074–18081; [DOI] [PubMed] [Google Scholar]; c) Zhang P, Zhou L, Wang R, Zhou X, Jiang J, Wan Z, Wang S, Nat. Commun 2022, 13, 2298. [DOI] [PMC free article] [PubMed] [Google Scholar]
- [26].Liu Y-N, Lv Z-T, Lv W-L, Liu X-W, Proc. Natl. Acad. Sci. U.S.A 2020, 117, 27148–27153. [DOI] [PMC free article] [PubMed] [Google Scholar]
- [27].Fan J, Suo J, Wu J, Xie H, Shen Y, Chen F, Wang G, Cao L, Jin G, He Q, Li T, Luan G, Kong L, Zheng Z, Dai Q, Nat. Photonics 2019, 13, 809–816. [Google Scholar]
Associated Data
This section collects any data citations, data availability statements, or supplementary materials included in this article.


