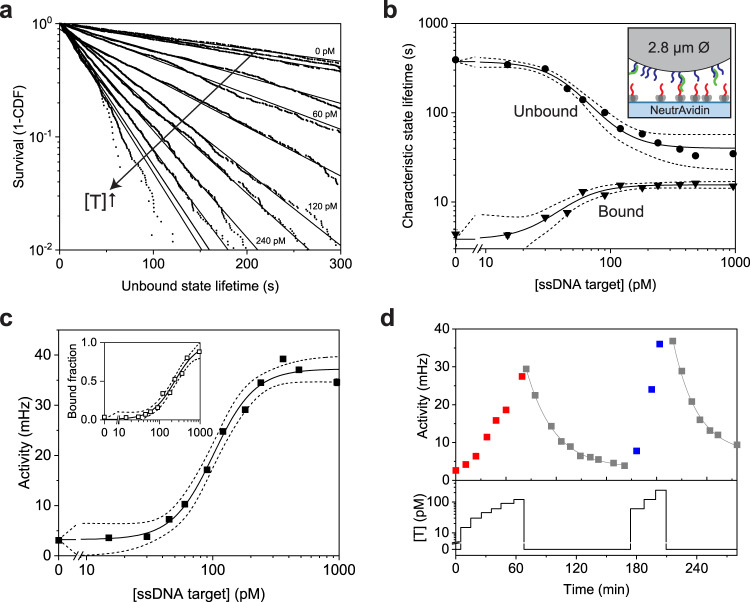
Fig. 3. Oligonucleotide sandwich assay using 2.8 μm particles.
a Survival curves of the characteristic unbound state lifetimes show a dependency on the target concentration [T]. With increasing ssDNA target concentration, the curves become steeper (black arrow), corresponding to shorter lifetimes. Data are fitted with a single exponential curve (see Supplementary Note 2.2) to extract the characteristic state lifetimes. b Characteristic unbound state lifetimes (circles) depend on the target concentration in a range of 15–300 pM. The sigmoidal fit (see “Methods” for fit equation) yields an EC50 of 45 ± 7 pM. The bound state lifetimes (triangles) depend weakly on target concentration. At low target concentrations, bound state lifetimes result mostly from short-lived, non-specific interactions. A gradual transition to specific bound states is observed. Data are presented as mean ± SE. The error bars are mostly smaller than the marker size. The inset shows the molecular design of the sensor, with NeutrAvidin on the substrate functionalized with partially single-stranded DNA binders (red) and with 2.8 μm particles functionalized with ssDNA binders (blue). The ssDNA target strand (green) can form sandwich complexes (via DNA hybridization) between the binders on particle and substrate (for details see Supplementary Note 3.2). c Measured activity as a function of target concentration, with a sigmoidal fit with an EC50 of 101 ± 7 pM. The inset shows the response expressed as the bound fraction, with an EC50 of 238 ± 39 pM. d Continuous monitoring of an applied concentration-time profile. The bottom panel shows the applied target concentration as a function of time; the top panel shows the measured switching activity. The relaxation curves are fitted with exponential decay functions (grey). The characteristic relaxation times are 28 ± 1 and 24 ± 2 min, and sensor functionality is retained after exposure to the blank solutions. Activity data in panels c and d are presented as mean ± SEM. Error bars for the activity are generally smaller than the marker size. The dashed lines in panels b and c indicate the 95% confidence interval of the sigmoidal fits and determine the error in the reported EC50 values. Source data are provided as a Source Data file.

