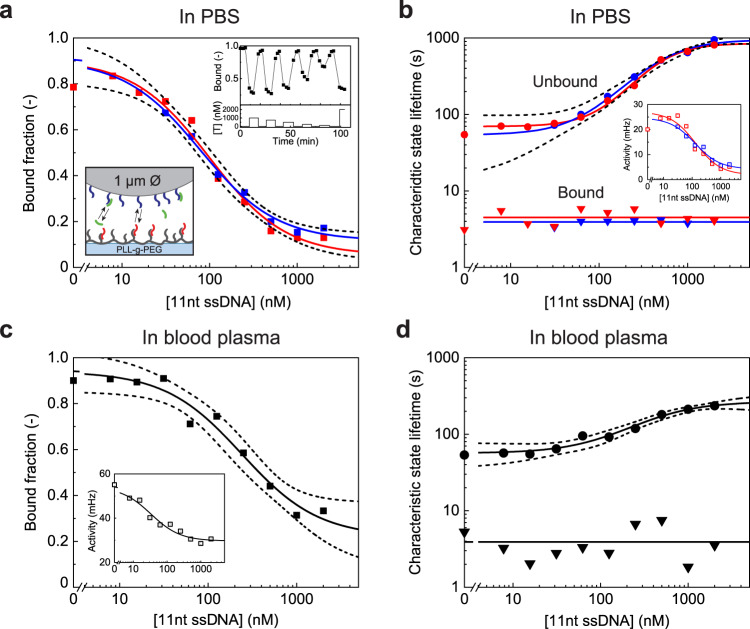
Fig. 4. Oligonucleotide competition assay in buffer and in filtered blood plasma, using 1 μm particles.
a The bound fraction as a function of target concentration ([T] = [11-nt ssDNA]). The red and blue squares represent two dose-response curves measured consecutively, demonstrating the reversibility of the sensor. The EC50 of the two dose-response curves fitted with sigmoidal curves (see “Methods” for fit equation) are 79 ± 22 nM and 100 ± 33 nM, respectively. The top inset shows the time-dependent response of bound fraction to alternating high and low analyte concentrations, demonstrating the fast response time of the sensor. The bottom inset shows the molecular design of the assay, with partially single-stranded DNA particle-side binders (blue), partially single-stranded DNA substrate-side binders (red), and ssDNA target molecules (green). The details of the surface chemistry and DNA hybridization are included in Supplementary Note 3.2. b Characteristic unbound state lifetimes are dependent on the target concentration in a range of 10 to 2000 nM. The unbound state lifetime curve has a sigmoidal shape with an EC50 of 461 ± 41 nM. The bound state lifetimes (triangles) are independent of the target concentration, with an average of 4 ± 1 s (solid horizontal lines). The inset shows the dose-response curves plotted as switching activity; the fitted EC50 values are 110 ± 78 nM and 127 ± 58 nM. c Bound fraction measured in 50 kDa spin-filtered bovine blood plasma, with an EC50 of 241 ± 83 nM. The inset shows the switching activity as a function of target concentration; the fitted EC50 value is 33 ± 15 nM. d Characteristic unbound and bound state lifetimes measured in filtered bovine blood plasma. Fitting the characteristic unbound state lifetime with a sigmoidal curve gives an EC50 of 421 ± 130 nM. The characteristic bound state lifetime is independent of target concentration with an average of 4 ± 2 s. Activity data in panels b and c are presented as mean ± SEM. Error bars for the activity are generally smaller than the marker size. The dashed lines in panels b and c indicate the 95% confidence interval of the sigmoidal fits and determine the error in the reported EC50 values. Source data are provided as a Source Data file.

