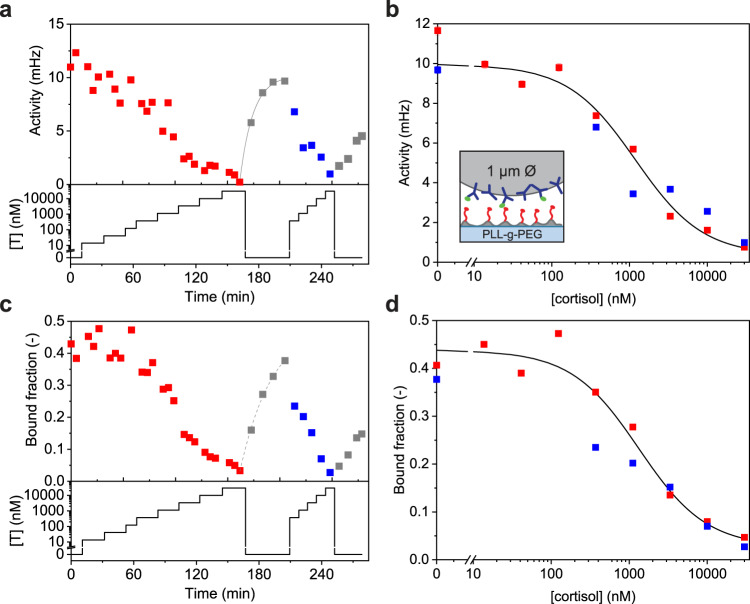
Fig. 5. Cortisol competition immunoassay.
a Dynamic sensor response to changes of cortisol concentration [T] including reversibility. Bottom panel: cortisol concentrations were applied over time in a stepwise increasing fashion, followed by blank solutions and a second cortisol concentration series. Top panel: the switching activity measured as a function of time. The grey line represents a single-exponential fit with a characteristic relaxation time of 13 ± 1 min. b Dose-response curve of cortisol measured in buffer, obtained from the same data as shown in panel a. A sigmoidal curve was fitted with an EC50 of 1.2 ± 0.5 μM (black line). The inset shows a schematic representation of the assay. Biotinylated antibodies (blue) coupled to 1 μm particles via biotin-streptavidin bonds, and cortisol-ssDNA conjugates (analogues, red) hybridized to DNA which is covalently coupled to a PLL-g-PEG layer using click chemistry (DBCO-azide). The reversible binding of antibodies to the analogues results in transient binding of particles to the substrate. In the presence of free cortisol (green), the antibodies bind to cortisol instead of the analogue, causing less binding of the particles to the substrate. c Same experiment as in panel a, but here the bound fraction is reported on the y-axis. Dashed grey line indicates sensor relaxation. d Dose-response curve obtained from the data shown in panel c. A sigmoidal fit is shown (black line) with an EC50 of 1.3 ± 0.2 μM. Activity data in panels a and b are presented as mean ± SEM. Error bars for the activity are generally smaller than the marker size. Source data are provided as a Source Data file.

