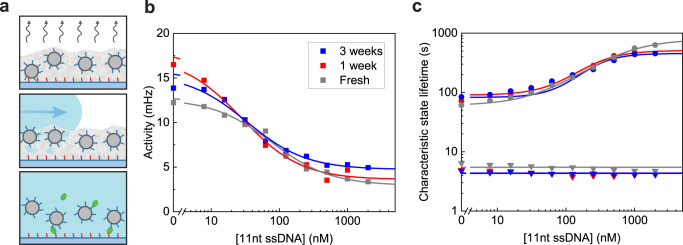
Fig. 6. Sensor design with conservation layer.
a Schematic of the processes to dry and rehydrate the particles. The grey layer represents the disaccharide layer (sucrose and trehalose) with 1 μm particles functionalized with particle-side binders (blue), deposited on a PLL-g-PEG surface with substrate-side binders (red). In the top panel, the disaccharide layer with particles is stored in a vacuum chamber and gradually dehydrated for long-term storage. In the middle panel, the disaccharide layer is rehydrated and the sensor chamber is washed with buffer. In the bottom panel, sample with target molecules is added to the sensor chamber and measurements are performed. b Sensor response characteristics for different storage conditions. The sensors stored for 1 and 3 weeks (red and blue data respectively) had a disaccharide layer. The control sample (fresh, grey data) was prepared without any sugar layer. The EC50 values of the three dose-response curves (fresh, one week, three weeks) are 77 ± 15 nM, 29 ± 5 nM and 30 ± 6 nM respectively. Data are presented as mean ± SEM. Error bars are generally smaller than the marker size. c Characteristic unbound state lifetimes are dependent on the target concentration in a range of 4 nM to 2 μM. The characteristic bound state lifetimes do not depend on concentration, with an average of 5 ± 1, 4 ± 1, and 4 ± 1 s (fresh, one week, three weeks). Source data are provided as a Source Data file.

