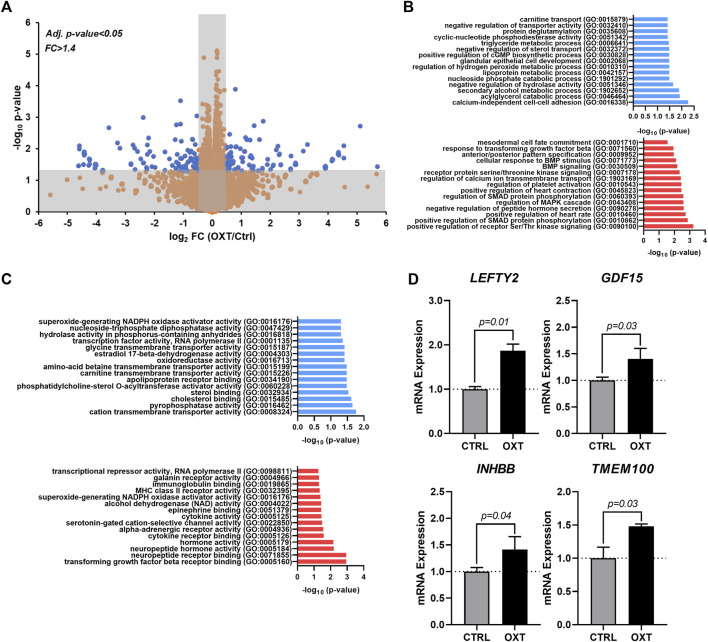
FIGURE 4.
Transcriptome Analysis of Oxytocin-Treated Human Epicardial Cells. (A) Volcano plot showing differentially expressed genes between control and OXT-treated hEpiCs, as determined by RNA sequencing; Blue dots correspond to genes with a fold change ≥1.4 and a p-value ≤ 0.05. (B,C) Gene ontology analysis showing upregulated and downregulated biological processes (B) and molecular functions (C) after oxytocin exposure in hEpiCs. (D) Relative mRNA expression of ligands for the TGF-β pathway and activators of BMP signaling in control and OXT-treated hEpiCs; n = 3 per condition.

