FIGURE 5.

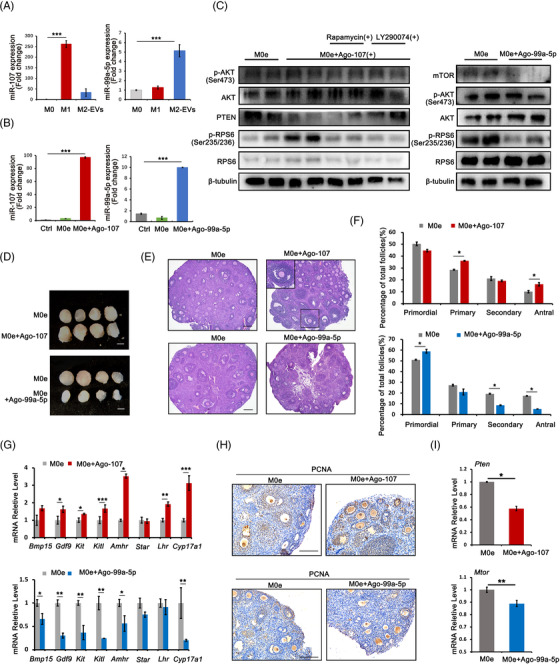
Extracellular vesicles (EVs)‐carried microRNAs participated in the regulation of macrophages (Mφs) on follicular activation and development. (A) Expression of miR‐107 and miR‐99a‐5p in M0, M1 and M2 Mφs‐derived EVs. (B) Expression of miR‐107 and miR‐99a‐5p in ovaries after different treatments. Ctrl: phosphate‐buffered saline (PBS); M0e: M0‐EVs; M0e + Ago‐107: M0‐EVs with agomir‐107; M0e + Ago‐99a‐5p: M0‐EVs with agomir‐99a‐5p. (C) Ovarian expression of p‐AKT (Ser473) and p‐RPS6 (Ser235/236) after 24 h of treatment. In M0e + Ago‐107 group, mTOR inhibitor rapamycin (Rapa) and PI3K inhibitor LY290074 was pretreated for 1 h and the protein levels of PTEN, the miR‐107 target was checked. In M0e + Ago‐99a‐5p group, the protein levels of mTOR, the target of miR‐99a‐5p was examined. The expression of AKT, RPS6 and β‐tubulin were used as internal control. (D) Comparisons of ovarian development after various treatment combinations. Paired ovaries were separated and treated with M0e or M0e + Ago‐107 and M0e or M0e + Ago‐99a‐5p, respectively, for 24 h. Paired ovaries with different treatments were then transplanted under kidney capsules of recipient mice for 14 days. Scale bar: 1 mm. (E) Ovarian histology between paired ovaries and distribution of different stages of follicles in paired ovaries treated with M0e and M0e + Ago‐107 and with M0e and M0e + Ago‐99a‐5p. Black frame: representative image of antral follicle. (F) Follicles counts revealed the percentage of follicles at different developmental stages in each treatment group. (G) Relative expression of follicular growth and development‐related genes in ovaries of each group. The levels of all tested mRNAs in M0e group were set to 1. (H) Ovarian proliferating cell nuclear antigen (PCNA) staining in nuclei of oocytes and granulosa cells in various groups. (I) Relative expression of in M0e + Ago‐107 and M0e + Ago‐99a‐5p‐treated ovaries, respectively. The expression of PTEN and mTOR mRNAs in M0e group were set to 1. Data represent the mean ± standard deviation (SD) of biological triplicate experiments. * p < .05, ** p < .01, *** p < .001, by one‐way analysis of variance (ANOVA) analysis. Scale bars: 50 μm
