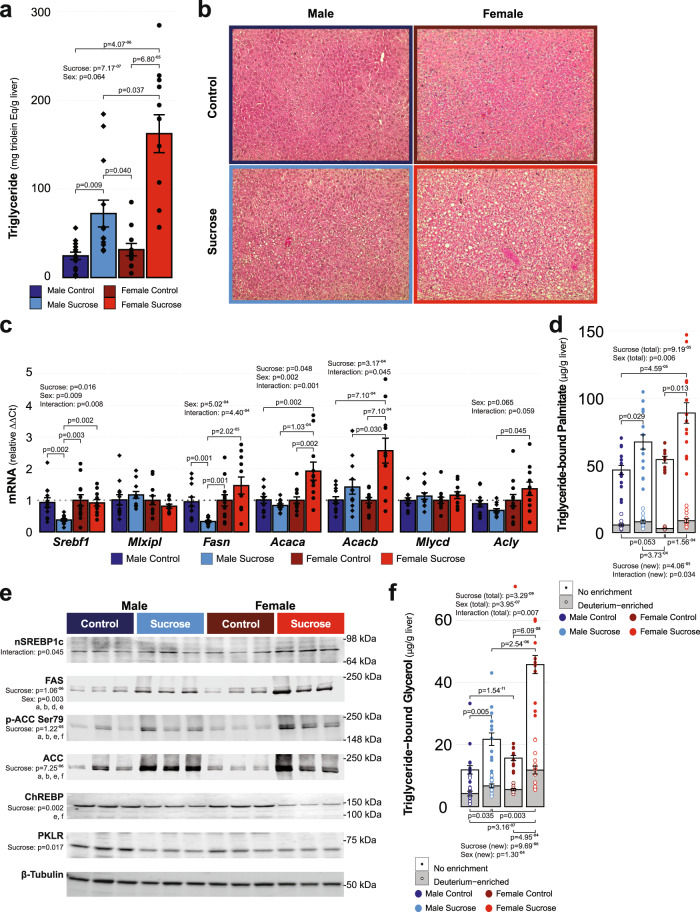
Fig. 2. Sucrose intake increases hepatic triglyceride content via sex-specific mechanisms.
a Sucrose intake increased hepatic triglyceride content in both sexes; however, the magnitude of the sucrose-driven increase was greatest in female mice, as determined by Scheirer–Ray–Hare test and post hoc Dunn analysis with Benjamini and Hochberg correction for multiple comparisons (MC: n = 14, MS: n = 13, FC: n = 11, FS: n = 12; see figure for p-values). b Representative hematoxylin and eosin staining of livers. c Transcriptional regulation of fatty acid synthesis also exhibited sex-specific effects of sucrose intake as determined in log-transformed data using two-way ANOVA with post hoc Tukey’s tests (MC: n = 12, MS: n = 12, FC: n = 12, FS: n = 11; see figure for p-values). d Transcriptional data were supported by mass spectrometry data demonstrating that sucrose intake increased the total pool of triglyceride-bound palmitate in both sexes, but only increased newly synthesized palmitate in females, as determined in log-transformed data using two-way ANOVA with post hoc Tukey’s tests (MC: n = 14, MS: n = 14, FC: n = 10, FS: n = 13; see figure for p-values). e Representative western blots demonstrating that the abundance of proteins encoded by the transcripts differentially expressed (as well as ChREBP and its target PKLR) between males and female mice in response to sucrose intake. Statistics were derived following densitometric quantification of bands from samples run on a single gel that were normalized to total protein and then log transformed and compared using two-way ANOVA with post hoc Tukey’s tests (FAS: ap= 1.43−4, bp = 1.55−4, dp = 0.044, ep = 2.80−6; pACC: ap = 0.001, bp = 0.007, ep = 2.8−4, fp = 0.041; ACC: ap = 0.001, bp = 0.003, ep = 2.99−4, fp = 0.014; ChREBP: ep = 0.024, fp = 0.010; MC: n = 6, MS: n = 6, FC: n = 6, FS: n = 6). f Total glycerol and glycerol from glyceroneogenesis were increased in both sexes in response to sucrose intake, with the magnitude of these increases greater in female mice as determined in transformed data using two-way ANOVA with posthoc Tukey tests (MC: n = 14, MS: n = 14, FC: n = 10, FS: n = 13). Data displayed are the group means ± standard error with biologically independent values overlayed. MC Male Control, MS Male Sucrose, FC Female Control, FS Female Sucrose. Source data, including uncropped and unprocessed blots, are provided in the source data file.

