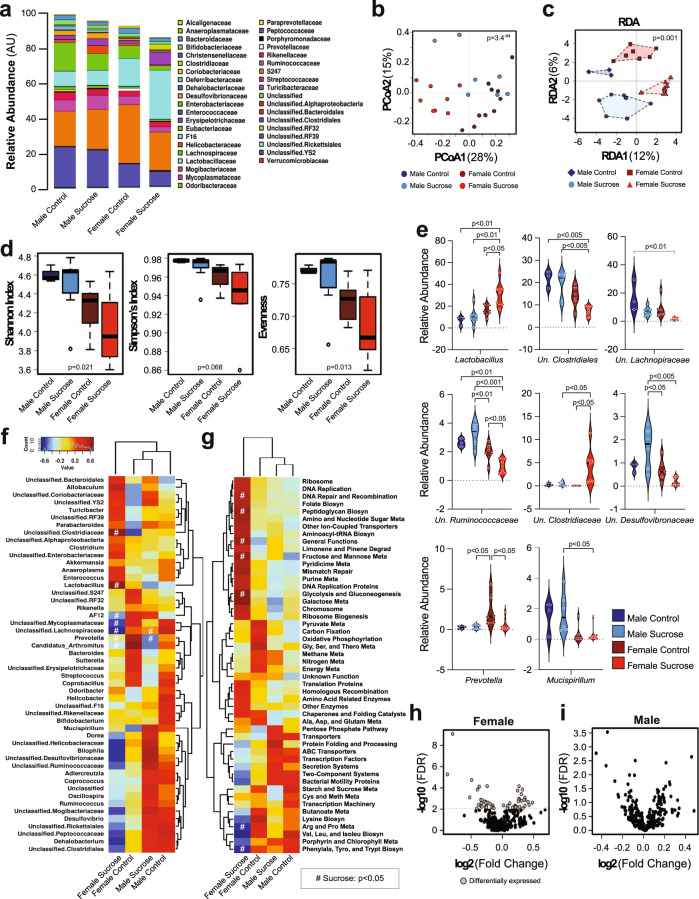
Fig. 6. Sucrose intake has sex-specific effects on the microbiome.
a Microbiome relative abundance at the family level. b Beta diversity assessed by Bray–Curtis analysis displayed as principal coordinate analysis (PCoA; PERMANOVA R2 0.33, p = 3.4−4; Anosim R = 0.512, p = 1.0−4; PERMDISP2 p = 0.355; MC: n = 3, MS: n = 7, FC: n = 7, FS: n = 8). c Redundancy analysis (RDA) identified significantly dissimilar group clustering of beta diversity (Variance = 117, F = 2.12, p = 0.001). d Female mice have reduced alpha diversity as determined by Shannon (p = 0.021), Simpson’s (p = 0.068), and Evenness indices (p = 0.013; MC: n = 3, MS: n = 7, FC: n = 7, FS: n = 8, boxes extend between the Q1 to Q3 interquartile range with the line representing the median and the whiskers extending between the minima and maxima. Dots represent statistical outliers). e Significant changes in the top 8 most abundant genera and unclassified (Un.) family levels as assessed by one-way ANOVA with post hoc Tukey’s tests (MC: n = 3, MS: n = 7, FC: n = 7, FS: n = 8; violin plots extend between the minima and maxima with the solid line representing the mean, the dotted lines representing the Q1 to Q3 interquartile range, and the width representing the distribution of data. Each biologically independent value is overlayed). f Heatmap of the 50 most abundant genus or unclassified family levels as calculated by spearman’s rank correlation coefficient. Significance was determined using one-way ANOVA assessing the effect of sucrose (#p < 0.05 compared to same-sex control group). g Heatmap of the 50 most abundant predicted metabolic pathways as determined by PICRUSt and calculated by spearman’s rank correlation coefficient. Significance was determined using one-way ANOVA assessing the effect of sucrose (#p < 0.05 compared to same-sex control group). h, i Deseq2 volcano plot of KEGG genes in PICRUSt from female (h), and male (i) mice following sucrose intake compared to their respective control groups. MC Male Control, MS Male Sucrose, FC Female Control, FS Female Sucrose. Source data are provided in the source data file, Log2 fold change and log10 FDR adjusted p-values are available in Supplementary File 5, and raw data are available from the NCBI BioProject database, accession number PRJNA883667.

