FIGURE 2.

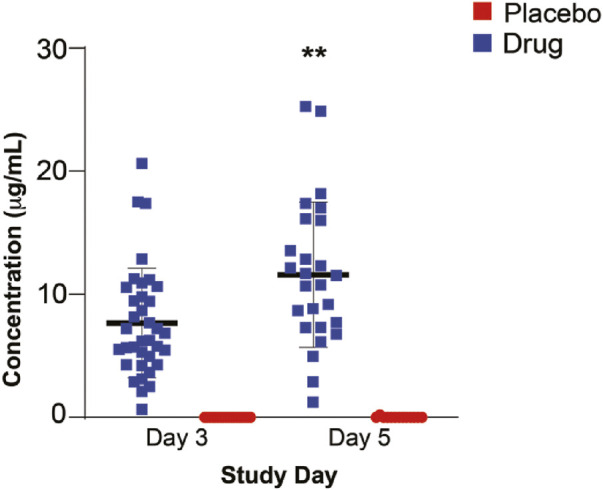
Atovaquone Plasma Concentration. Atovaquone plasma concentration measured at day 3 and 5 following initiation of therapy. Day 3 drug levels were significantly lower than those of day 5. (**p < 0.005).

Atovaquone Plasma Concentration. Atovaquone plasma concentration measured at day 3 and 5 following initiation of therapy. Day 3 drug levels were significantly lower than those of day 5. (**p < 0.005).