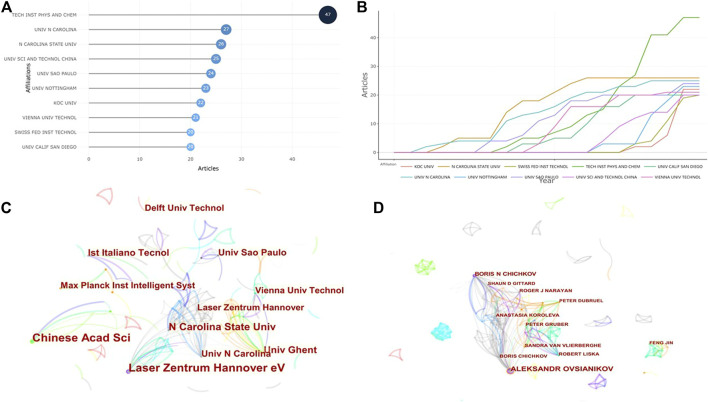
FIGURE 4.
Visual analysis of institutions and authors concerning publications of TPP applications in biomedical field. (A) The top 10 institutions with the most published papers; (B) Production of the top 10 institutions with the highest productivity over time. (C) The network of cooperative relations between institutions. (D) The network of cooperative relations between authors.

