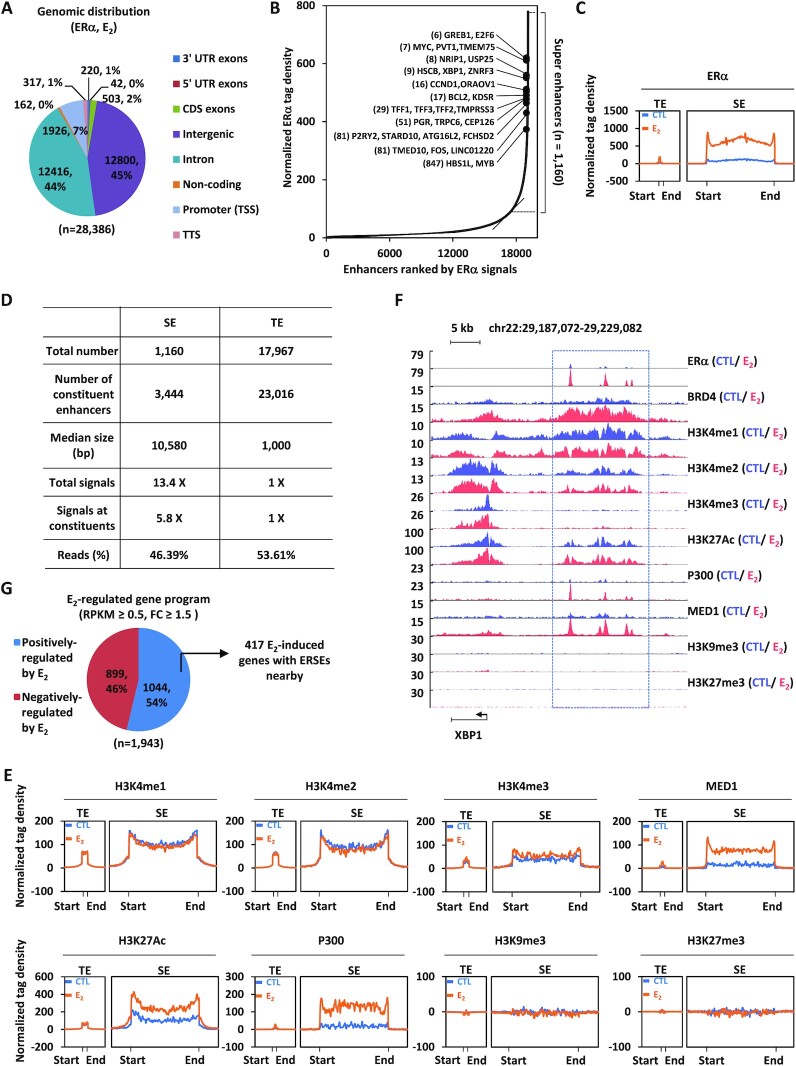
Figure 1.
ERSEs are highly active in ERα-positive breast cancer. (A) MCF7 cells treated with estrogen (E2, 10−7 M, 1 h) were subjected to ChIP-seq with anti-ERα-specific antibody. Genomic distribution of ERα-binding sites is shown by a pie chart. (B) Normalized ERα ChIP-seq tag density in enhancer regions after clustering is shown. Estrogen-induced genes in the vicinity of representative ERSEs are shown. The number in parentheses indicates the rank of ChIP-seq tag density. (C) Metagene representation of ERα occupancy at typical enhancers (TEs) and super-enhancers (SEs) is shown. The x-axis shows the start and end of the TE (left) or SE (right) regions flanked by a 3 kb sequence. The y-axis shows the normalized tag density. (D) The characteristics of TEs and SEs defined by ERα are shown. (E) Metagene representation of H3K4me1, H3K4me2, H3K4me3, MED1, H3K27Ac, P300, H3K9me3 and H3K27me3 occupancy at TEs and SEs is shown. The x-axis shows the start and end of the TE (left) or SE (right) regions flanked by ± 3 kb sequence. The y-axis shows the normalized tag density. (F) UCSC Genome browser views of ERα, BRD4, H3K4me1, H3K4me2, H3K4me3, H3K27Ac, P300, MED1, H3K9me3 and H3K27me3 ChIP-seq in the presence or absence of estrogen on the SE region in the vicinity of the estrogen-induced gene, XBP1. The boxed region indicates SEs. (G) MCF7 cells treated or not with estrogen (E2, 10−7 M, 1 h) were subjected to Gro-seq. Genes positively and negatively regulated by estrogen based on Gro-seq, and those with an SE nearby are shown.

