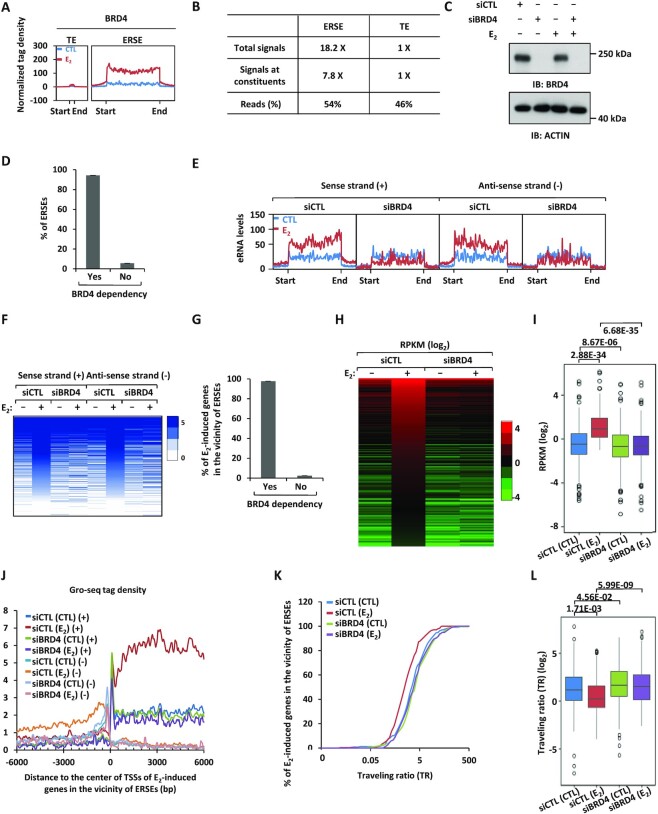
Figure 2.
BRD4 is a master regulator of the transcriptional activation of ERSEs as well as of estrogen target genes in the vicinity. (A) MCF7 cells treated or not with estrogen (E2, 10−7 M, 1 h) were subjected to ChIP-seq with anti-BRD4-specific antibody. Metagene representation of BRD4 occupancy at typical enhancers (TEs) and ERSEs is shown. The x-axis shows the start and end of the TE (left) or SE (right) regions flanked by ± 3 kb sequence. The y-axis shows the normalized tag density. (B) Statistics of BRD4 ChIP-seq on TEs and ERSEs. (C) MCF7 cells transfected with control siRNA (siCTL) or siRNAs specifically targeting BRD4 (siBRD4) were treated or not with estrogen (E2, 10−7 M, 1 h), followed by immunoblotting (IB) analysis using antibodies as indicated. Molecular weight is indicated on the right (in kDa). (D) MCF7 cells as described in (C) were subjected to Gro-seq analysis. The levels of eRNA were calculated, and the percentage of BRD4-dependent SEs is shown. (E, F) eRNA levels on both sense and antisense strands on ERSEs as detected by Gro-seq as described in (D) are shown by tag density plot (E) and heat map (F). (G) The percentage of ERSE-associated and estrogen-induced genes that are BRD4 dependent is shown. (H, I) The expression of ERSE-associated and estrogen-induced genes that are BRD4 dependent is shown by heat map (H) and box plot (I) (unpaired Student's t-test, two-tailed). (J) Gro-seq tag density, both sense (+) and antisense (−), centered on the TSSs (± 6000 bp) of ERSE-associated and estrogen-induced genes that are BRD4 dependent is shown. (K) Traveling ratio (TR) distribution calculated based on Gro-seq tag density for ERSE-associated and estrogen-induced genes that are BRD4 dependent. (L) The change of the TR as shown in (K) is shown by box plot (unpaired Student's t-test, two-tailed).

