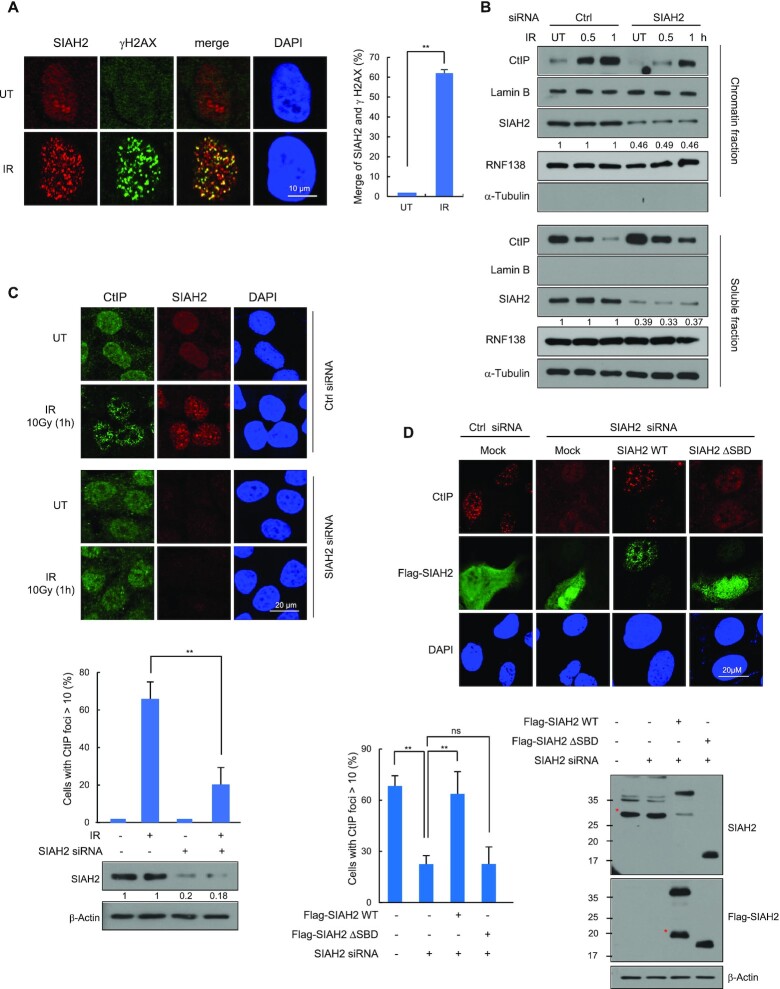
Figure 2.
SIAH2 stimulates CtIP recruitment to DSB sites. (A) HeLa cells were either untreated or treated with 5 Gy of IR, fixed at 1 h, and immunostained with anti-SIAH2 and anti-γ-H2AX antibodies. Colocalization of SIAH2 (red) and γ-H2AX (green) in cells appears yellow in the merged image. DNA was stained with DAPI. The percent colocalization between SIAH2 and γ-H2AX is shown. Results are shown as the mean ± SD (n = 3), **P < 0.01, two-tailed Student's t-test. (B) Control and SIAH2-depleted HeLa cells were either untreated or treated with 5 Gy IR. At the indicated time point after IR, chromatin and soluble fractions were extracted and analyzed by western blotting. (C) Control and SIAH2-depleted HeLa cells were either untreated or treated with 5 Gy IR, fixed at 1 h, and immunostained with anti-CtIP and anti-SIAH2 antibodies. DNA was stained with DAPI. Representative images and the percentage of cells containing >10 CtIP foci are shown. The numbers were relative levels of SIAH2 expression compared to untreated control siRNA-transfected cells. Data represent mean ± SD (n = 3), **P < 0.01, two-tailed Student's t-test. (D) The number of CtIP foci was measured 1 h after IR treatment in control Hela cells or SIAH2-depleted HeLa cells reconstituted with Flag-Mock, Flag-SIAH2 WT, or Flag-SIAH2 ΔSBD. Representative images and the percentage of cells containing >10 CtIP foci in Flag-positive cells are shown. Asterisks indicate nonspecific bands.

