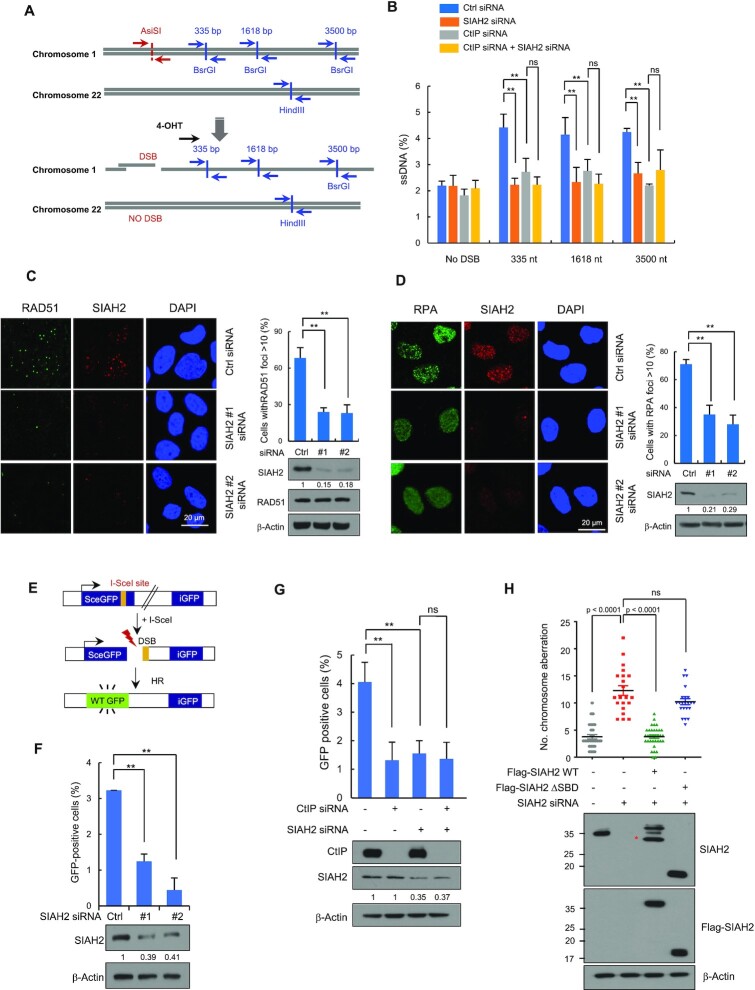
Figure 4.
SIAH2 promotes DNA end resection and HR repair. (A) Schematic illustration of qPCR primers (blue arrow) used for measuring resection at sites adjacent to the AsiSI sites (red arrow). (B) Quantification of ssDNA generated by 5’ end resection at three AsiSI-induced DSBs in AsiSI-ER-U2OS cells transfected with either control siRNA or siRNAs against CtIP, SIAH2 or both SIAH2 and CtIP. Data represent mean ± SD (n = 3), **P < 0.01. ns, nonsignificant, two-tailed Student's t-test. (C and D) Control and SIAH2-depleted HeLa cells were treated with 5 Gy IR, fixed at 3 h, and immunostained with anti-RAD51 and anti-SIAH2 antibodies (C) or with anti-RPA and anti-SIAH2 antibodies (D). DNA was stained with DAPI. The percentage of cells containing >10 foci was calculated. Representative images and quantification of RAD51 and RPA foci are shown. Whole cell lysates were analyzed by immunoblotting using the indicated antibodies. Data represent mean ± SD (n = 3), **P < 0.01, two-tailed Student's t-test. (E) A schematic of the DR-GFP reporter system used to measure rates of homologous recombination (HR). (F and G) HR efficiency in control- and SIAH2-depleted DR-GFP-U2OS cells (F) and DR-GFP-U2OS cells transfected with the indicated siRNA combinations (G). The cells were transfected with an I-SceI expression plasmid for 48 h and HR efficiency was determined by FACS. An immunoblot confirming the presence of proteins after transfection is presented in the bottom panel. The numbers were relative levels of SIAH2 expression compared to control siRNA-transfected cells. Data represent mean ± SD (n = 3), **P < 0.01. ns, nonsignificant, two-tailed Student's t-test. (H) Quantification of chromosomal aberrations in either control or SIAH2-depleted HeLa cells reconstituted with Flag-Mock, Flag-SIAH2 WT or Flag-SIAH2 ΔSBD 24 h after treatment with 2 Gy of IR. Dot plot shows the number of chromosomal aberrations per cells. Data represent mean ± SD (n = 3) ns, nonsignificant. P values between indicated samples were calculated using a Mann–Whitney test. Asterisk indicates nonspecific band.

