Figure 7.
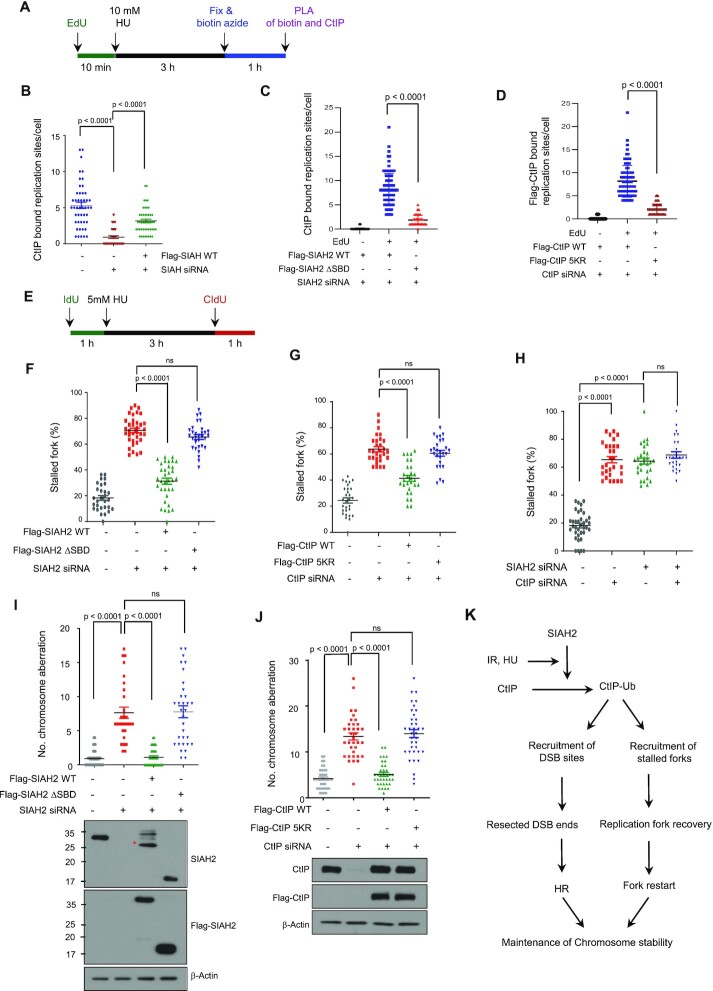
SIAH2 promotes CtIP accumulation at replication forks and promotes recovery of stalled forks. (A) Experimental scheme of the SIRF assay to measure interactions between CtIP and nascent DNA in single cells. (B) Control HeLa cells, SIAH2-depleted HeLa cells, and SIAH2-depleted HeLa cells reconstituted with Flag-SIAH2 were pulse labeled with EdU for 10 min, followed by 10 mM HU treatment for 3 h. Localization of CtIP at the nascent forks was detected through the SIRF assay. Data represent mean ± SD (n = 3). P values between indicated samples were calculated using a Mann–Whitney test. (C and D) Localization of CtIP at the nascent forks, measured using the assay described in (B), in SIAH2-depleted HeLa cells reconstituted with either Flag-SIAH2 WT or Flag-SIAH2 ΔSBD (C) and CtIP-depleted HeLa cells reconstituted with either Flag-CtIP WT or Flag-CtIP-5KR (D). Data represent mean ± SD (n = 3). P values between indicated samples were calculated using a Mann–Whitney test. (E) Schematic for labelling HeLa cells with CIdU and IdU. (F–H) Double-labeled DNA fibers in control HeLa cells or SIAH2-depleted HeLa cells reconstituted with Flag-Mock, Flag-SIAH2 WT or Flag-SIAH2 ΔSBD (F), control HeLa cells or CtIP-depleted HeLa cells reconstituted with Flag-Mock, Flag-CtIP WT or Flag-CtIP-5KR (G) and control HeLa cells or HeLa cells transfected with the indicated siRNA combinations (H) to quantify stalled replication forks. Data are presented as means ± SD (n = 3). P values between indicated samples were calculated using a Mann–Whitney test. (I and J) Analysis of chromosome aberrations was carried out with SIAH2-depleted HeLa cells reconstituted with Flag-Mock, Flag-SIAH2 WT or Flag-SIAH2 ΔSBD (I) and CtIP-depleted HeLa cells reconstituted with Flag-Mock, Flag-CtIP WT or Flag-CtIP-5KR (J) treated with 2 mM HU for 24 h. Dot plot shows the number of chromosome aberrations per cells. Data represent mean ± SD (n = 3), **P < 0.01. ns, nonsignificant. P values between indicated samples were calculated using a Mann–Whitney test. Asterisk indicates nonspecific band. (K) Schematic depicting the role of SIAH2 in CtIP function in end resection and replication fork recovery. See text for details.

