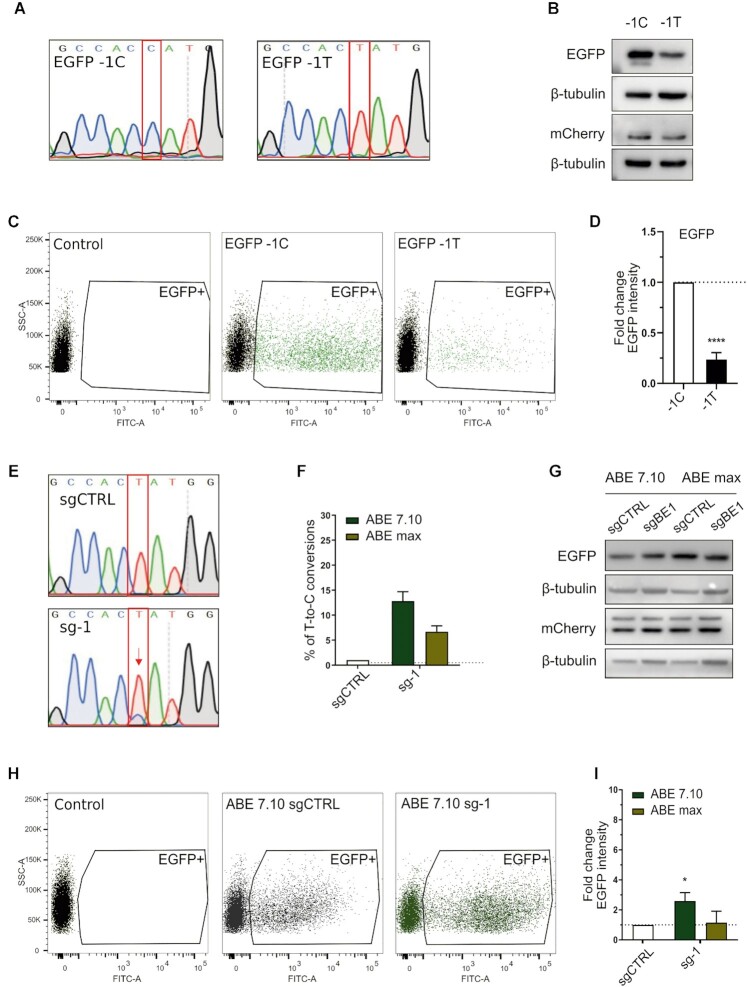
Figure 1.
Boosting of a suboptimal Kozak sequence by base editing. (A) Sanger sequencing chromatograms representing the wild-type (EGFP-1C) and the mutated EGFP version (EGFP-1T), with a single variation in position –1 of the Kozak sequence. (B) Western blot analysis of EGFP and mCherry expression in HEK293T cells transiently transfected with EGFP-1C or EGFP-1T plasmids. (C) Representative FACS dot plots of HEK293T cells three days after transient transfection. (D) FACS analysis of HEK293T cells transiently transfected with the respective plasmids. The average EGFP intensity of EGFP-1T is normalised over EGFP-1C. Data are reported as mean ± SD of n = 3 biological replicates. Statistically significant differences were calculated by unpaired t-test. (E) Representative Sanger sequencing chromatograms of HEK293T cells edited with the ABE7.10 base editor and sg-1, compared with ABE7.10 combined with a scrambled sgRNA (sgCTRL). (F) Percentage of correct T-to-C conversion analysed with the EditR software. (G) Western blot analysis of EGFP and mCherry expression in HEK293T cells edited with ABE 7.10 or ABEmax combined with sg-1 or sgCTRL. (H) Representative FACS dot plots of cells edited with ABE7.10 and sg-1, compared with ABE7.10 combined with a scrambled sgRNA (sgCTRL) 3 days after transfection. (I). FACS analysis of EGFP expression in cells transfected with the base editors (ABE7.10 and ABEmax) and sgCTRL or sg-1. The average EGFP intensity of sg-1 is normalised over sgCTRL. Data are means ± SD from n = 3 biological replicates. Statistically significant differences were calculated by unpaired t-test (P value = 0,0483).

