Figure 3.
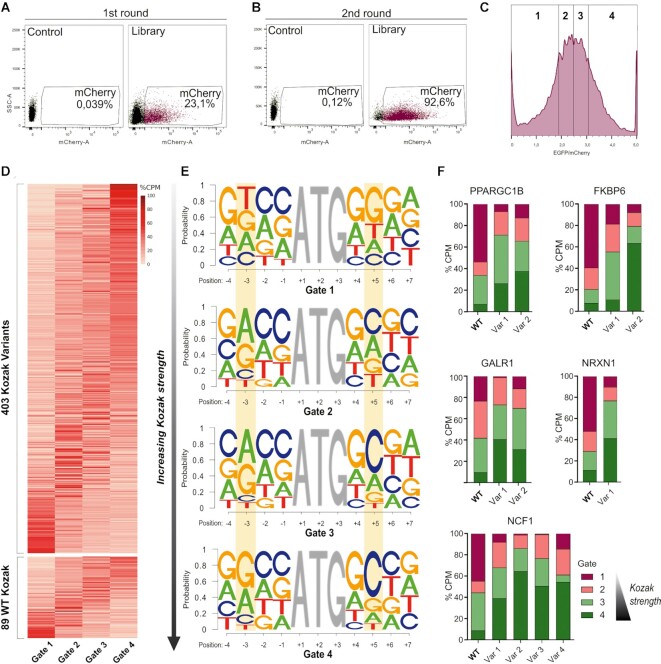
High-throughput determination of protein levels from Kozak sequence variants. (A) mCherry expression of the transduced cells in FACS-seq first round of sorting. 5 × 10⁶ mCherry-positive cells (23.1% of the total) were sorted. (B) FACS-seq second round of sorting. (C) mCherry-positive cells from the gate drawn in (B) were divided into four gates according to EGFP/mCherry expression, defined in such a way that each bin contains 25% of the total population of interest. (D) The heatmap represents the distribution of the percentage of the count per million reads (CPM) in the four gates of the candidate HI genes and variants which passed the statistical analysis. In the upper panel, the Kozak variants are represented. The WT Kozak sequences of the HI genes are shown in the lower panel. Each column corresponds to one of the four gates, while each row stands for one of the Kozak sequences. Rows are ordered by the expected value (EV) of the corresponding sequence. (E) Logo representation of the Kozak sequences extracted from each of the four gates. In each panel, the positions along the Kozak sequence (with A of ATG being position +1) are represented on the x-axis, and the probability of occurrence of each base is shown on the y-axis. Gate 1 (upper panel) represents the lowest translational efficiency, while gate 4 (lower panel) corresponds to the most performing Kozak sequences. Relevant positions (–3 and +5) are highlighted in yellow. (F) Percentage of the count per million reads (CPM) in the four gates of the wild-type (WT) and the respective variants (Var) of the five selected genes.

