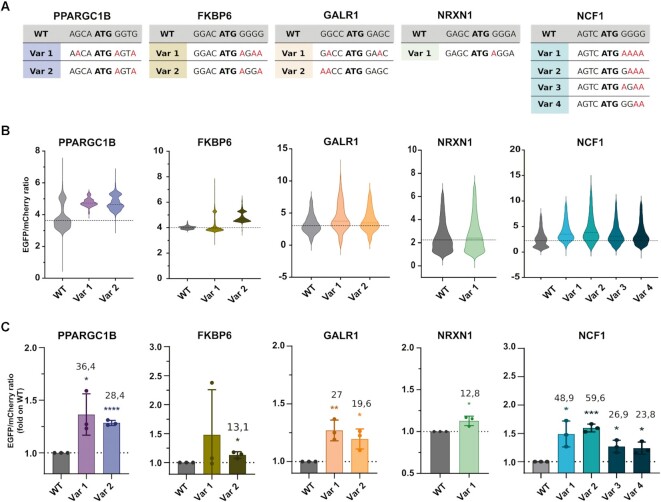
Figure 4.
Validation of actionable hit variants. (A) Wild-type (WT) and variants (Var) Kozak sequences of the selected hit genes. (B) Translational enhancement analysed as EGFP/mCherry expression by high content image analysis. The violin plots report the data distribution from n = 3 biological replicates. The dashed line indicates the population median. (C) The histogram represents the mean of the populations analysed by high content image analysis. Data are means ± SD from n = 3 biological replicates. The numbers indicate the percentage of mean increase of the variants over the WT. Statistically significant differences were calculated using the unpaired t-test of each variant versus the corresponding WT.

