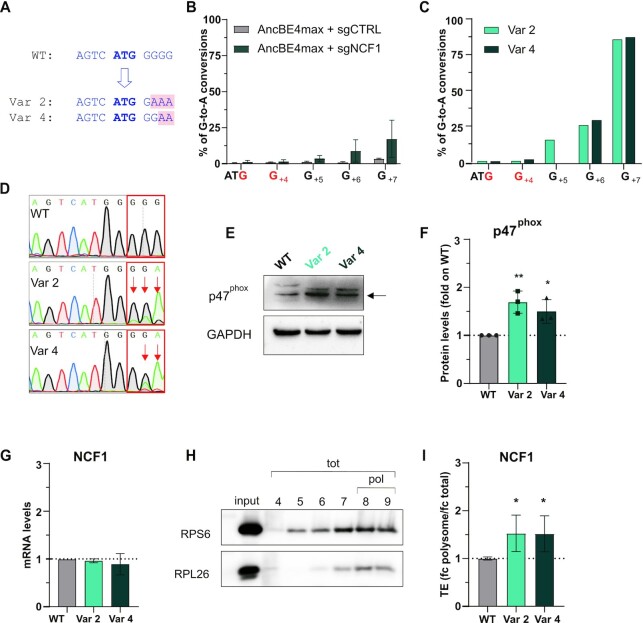
Figure 5.
BOOST of the NCF1 Kozak sequence. (A) Schematic representation of the NCF1 wild-type (WT), variant 2 (Var 2) and variant 4 (Var 4) Kozak sequences. The starting codon is bold blue; the base changes in the variants are highlighted in pink. (B) Editing efficiency in the Raji bulk population at target and bystander (in red) guanines analysed with the EditR software five days post-electroporation of AncBE4max and sgNCF1 or sgCTRL. The percentage of corrected G-to-A conversions (y-axis) is shown for each position in the NCF1 Kozak sequence (x-axis, with the A of ATG being position + 1). Data are means ± SD from n = 3 independent experiments. (C). Editing efficiency in the two clones isolated from the bulk population (Var 2 and Var 4 cells) at target and bystander (in red) guanines. (D) Sanger sequencing chromatograms of NCF1 Kozak sequence in Raji WT, Var 2 and Var 4 cells. (E) Western blot analysis of the p47phox protein in Raji cells (WT, Var 2, and Var 4). One representative blot result is shown. The arrow indicates the 47KDa band corresponding to p47phox. (F) Western blot quantification. p47phox levels were normalised on the housekeeping protein, and the fold change with respect to the WT levels is shown, n = 3 biological replicates. (G) qPCR of NCF1 on WT, Var 2 or Var 4 Raji cells. Data are means ± SD from n = 3 independent experiments. (H). Representative western blot of two polysomal markers (RPS6 and RPL26) in the fractions isolated by sucrose gradient centrifugation. The input is the cellular cytoplasmic lysate loaded on the sucrose gradient. tot= fractions corresponding to the total RNA; pol= fractions selected as polysomes and used in (I). (I) Translational efficiency (TE) quantification of NCF1 in Var 2 and Var 4 cells with respect to the WT cells. TE is the ratio between polysomal (fractions 8–9) and total (fractions 4–9) mRNA levels (fold change polysome/fold change total) measured by qPCR. Data are means ± SD from n = 3 independent experiments. Statistically significant differences were calculated by unpaired t-test of each variant versus the WT.

