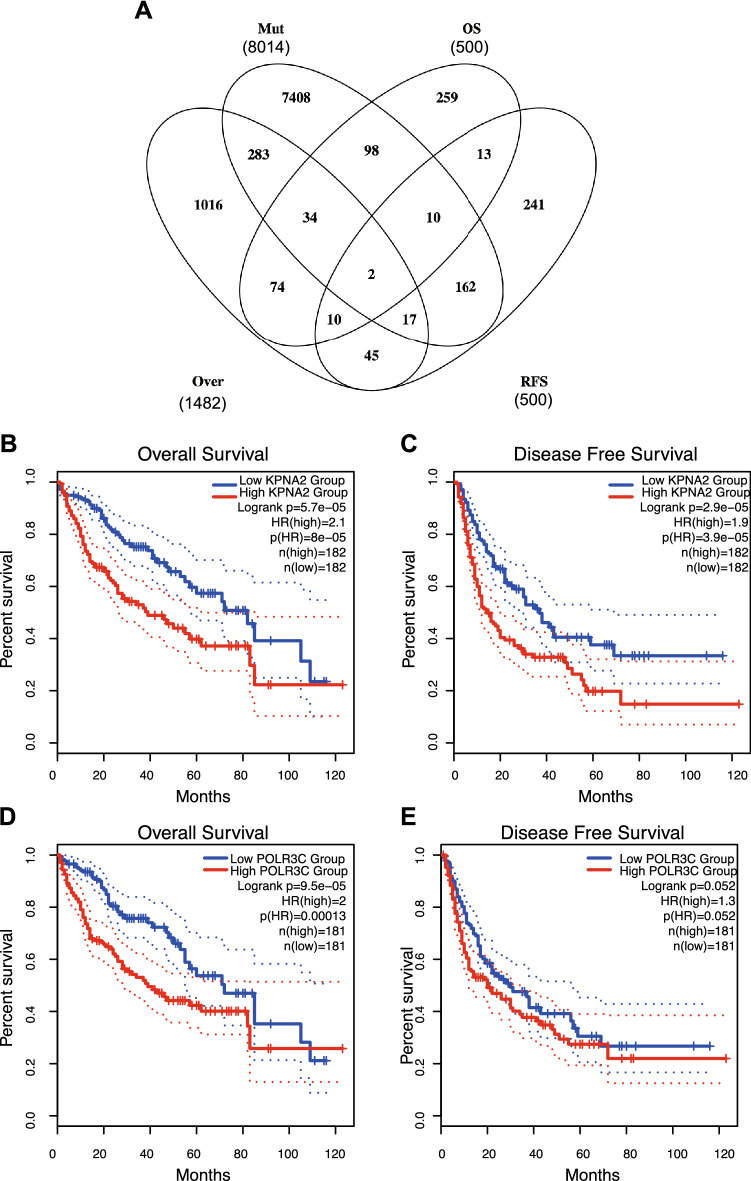
Fig. 2.
Identification of LIHC prognosis-related tumor neoantigens. A Venn diagram showing the candidate neoantigens associated with high expression, mutations, OS and RFS (2 candidates in total). B–E Kaplan–Meier curves showing the OS of LIHC patients stratified on the basis of B POLR3C and D KPNA2 expression levels and RFS according to C POLR3C and E KPNA2 expression levels

