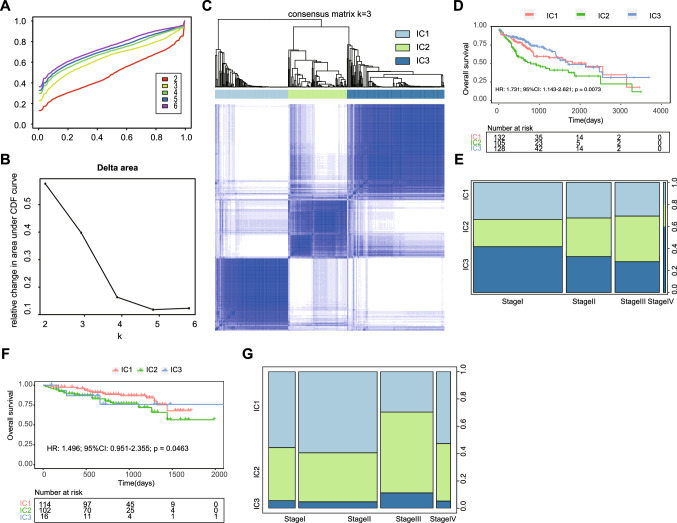
Fig. 4.
Identification of potential immune clusters of LIHC. A Cumulative distribution function curve and B delta area of immune-related genes in the TCGA cohort. C Sample clustering heatmap. D Kaplan–Meier curves showing the OS of LIHC immune clusters in the TCGA cohort. E Distribution of IC1-IC3 across LIHC stages in the TCGA cohort. F Kaplan–Meier curves showing the OS of LIHC immune clusters in the ICGC cohort. G Distribution ratio of IC1-IC3 across LIHC stages in the ICGC cohort

